The Building Cost Information Service (BCIS) is the leading provider of cost and carbon data to the UK built environment. Over 4,000 subscribing consultants, clients and contractors use BCIS products to control costs, manage budgets, mitigate risk and improve project performance.
Published: 12/08/2025
After months of speculation, the arrival of the Infrastructure Pipeline via an interactive portal in mid-July brought relief, and at a first glance, appeared to be a modern improvement on its predecessors.
A closer inspection, however, tells a slightly different story. In its current shape, the pipeline has significant data gaps and provides little to no detail on the funding mechanisms for projects, beyond labelling public or private sector backing.
NISTA (National Infrastructure and Service Transformation Authority) has clearly moved things on with the portal set up, but this is overshadowed by the continued lack of clarity. The pipeline’s confirmation of projects is certainly useful knowledge but whether it provides the impetus for demand and investment in construction is debatable.
To date, NISTA’s downloadable pipeline spreadsheet reveals 994 projects are set to be delivered over the next decade.
Almost half (49%) of these are classed as energy schemes, 276 of which will be solar-based. Waste and wastewater and transport follow with 130 and 107 projects respectively.
| Sector | Sub-sector | Number of projects |
| Communications | Broadband | 1 |
| Communications | Mobile | 1 |
| Defence | Defence Estate | 76 |
| Education | Schools | 23 |
| Education | Other Social Infrastructure | 2 |
| Education | Further Education | 4 |
| Energy | Wind onshore | 23 |
| Energy | Electricity transmission | 5 |
| Energy | Solar | 276 |
| Energy | Gas Transmission | 8 |
| Energy | Nuclear Decommissioning | 74 |
| Energy | Other | 28 |
| Energy | Carbon capture and storage | 5 |
| Energy | Electricity Generation – other | 7 |
| Energy | Wind offshore | 13 |
| Energy | Interconnector | 8 |
| Energy | Gas Distribution | 21 |
| Energy | Nuclear generation | 8 |
| Energy | Tidal/wave | 6 |
| Energy | Oil & Gas | 2 |
| Flood/Coastal Defence | Flood/Coastal Defence | 20 |
| Health and Social Care | Health and Social Care | 6 |
| Housing and Regeneration | Other Social Infrastructure | 1 |
| Housing and Regeneration | Housing and Regeneration | 92 |
| Immigration | Immigration | 3 |
| Justice | N/A | 1 |
| Justice | HM Prisons/Custody | 3 |
| Other | N/A | 3 |
| Other Social Infrastructure | Other Social Infrastructure | 4 |
| Other Social Infrastructure | N/A | 1 |
| Police Forces | Police Forces | 1 |
| Science and Research | Science and Research | 29 |
| Transport | Rail | 29 |
| Transport | Road | 25 |
| Transport | Transport – other | 23 |
| Transport | Airports | 30 |
| Water and Wastewater | Water | 86 |
| Water and Wastewater | Wastewater | 44 |
| Sector not provided | N/A | 2 |
Source: NISTA
The pipeline also provides a breakdown by location too.
Looking at the downloadable project data, it’s evident the vast majority (more than 800) will be carried out in England. By comparison, Scotland has 64 projects, Wales 34 and Northern Ireland 4.
In England, the South East has the largest proportion of projects, comprising 16% (163 projects) of the total pipeline. This is followed by the North West with 145 projects and the South West with 109.
The table below shows a breakdown of projects that have been or will be undertaken in different regions in England. This doesn’t include projects that cover multiple regions or are national-level schemes.
| Region | Number of projects |
| Yorkshire and the Humber | 49 |
| North West | 145 |
| North East | 38 |
| East Midlands | 42 |
| West Midlands | 43 |
| South East | 163 |
| South West | 109 |
| London | 73 |
| East of England | 78 |
Source: NISTA
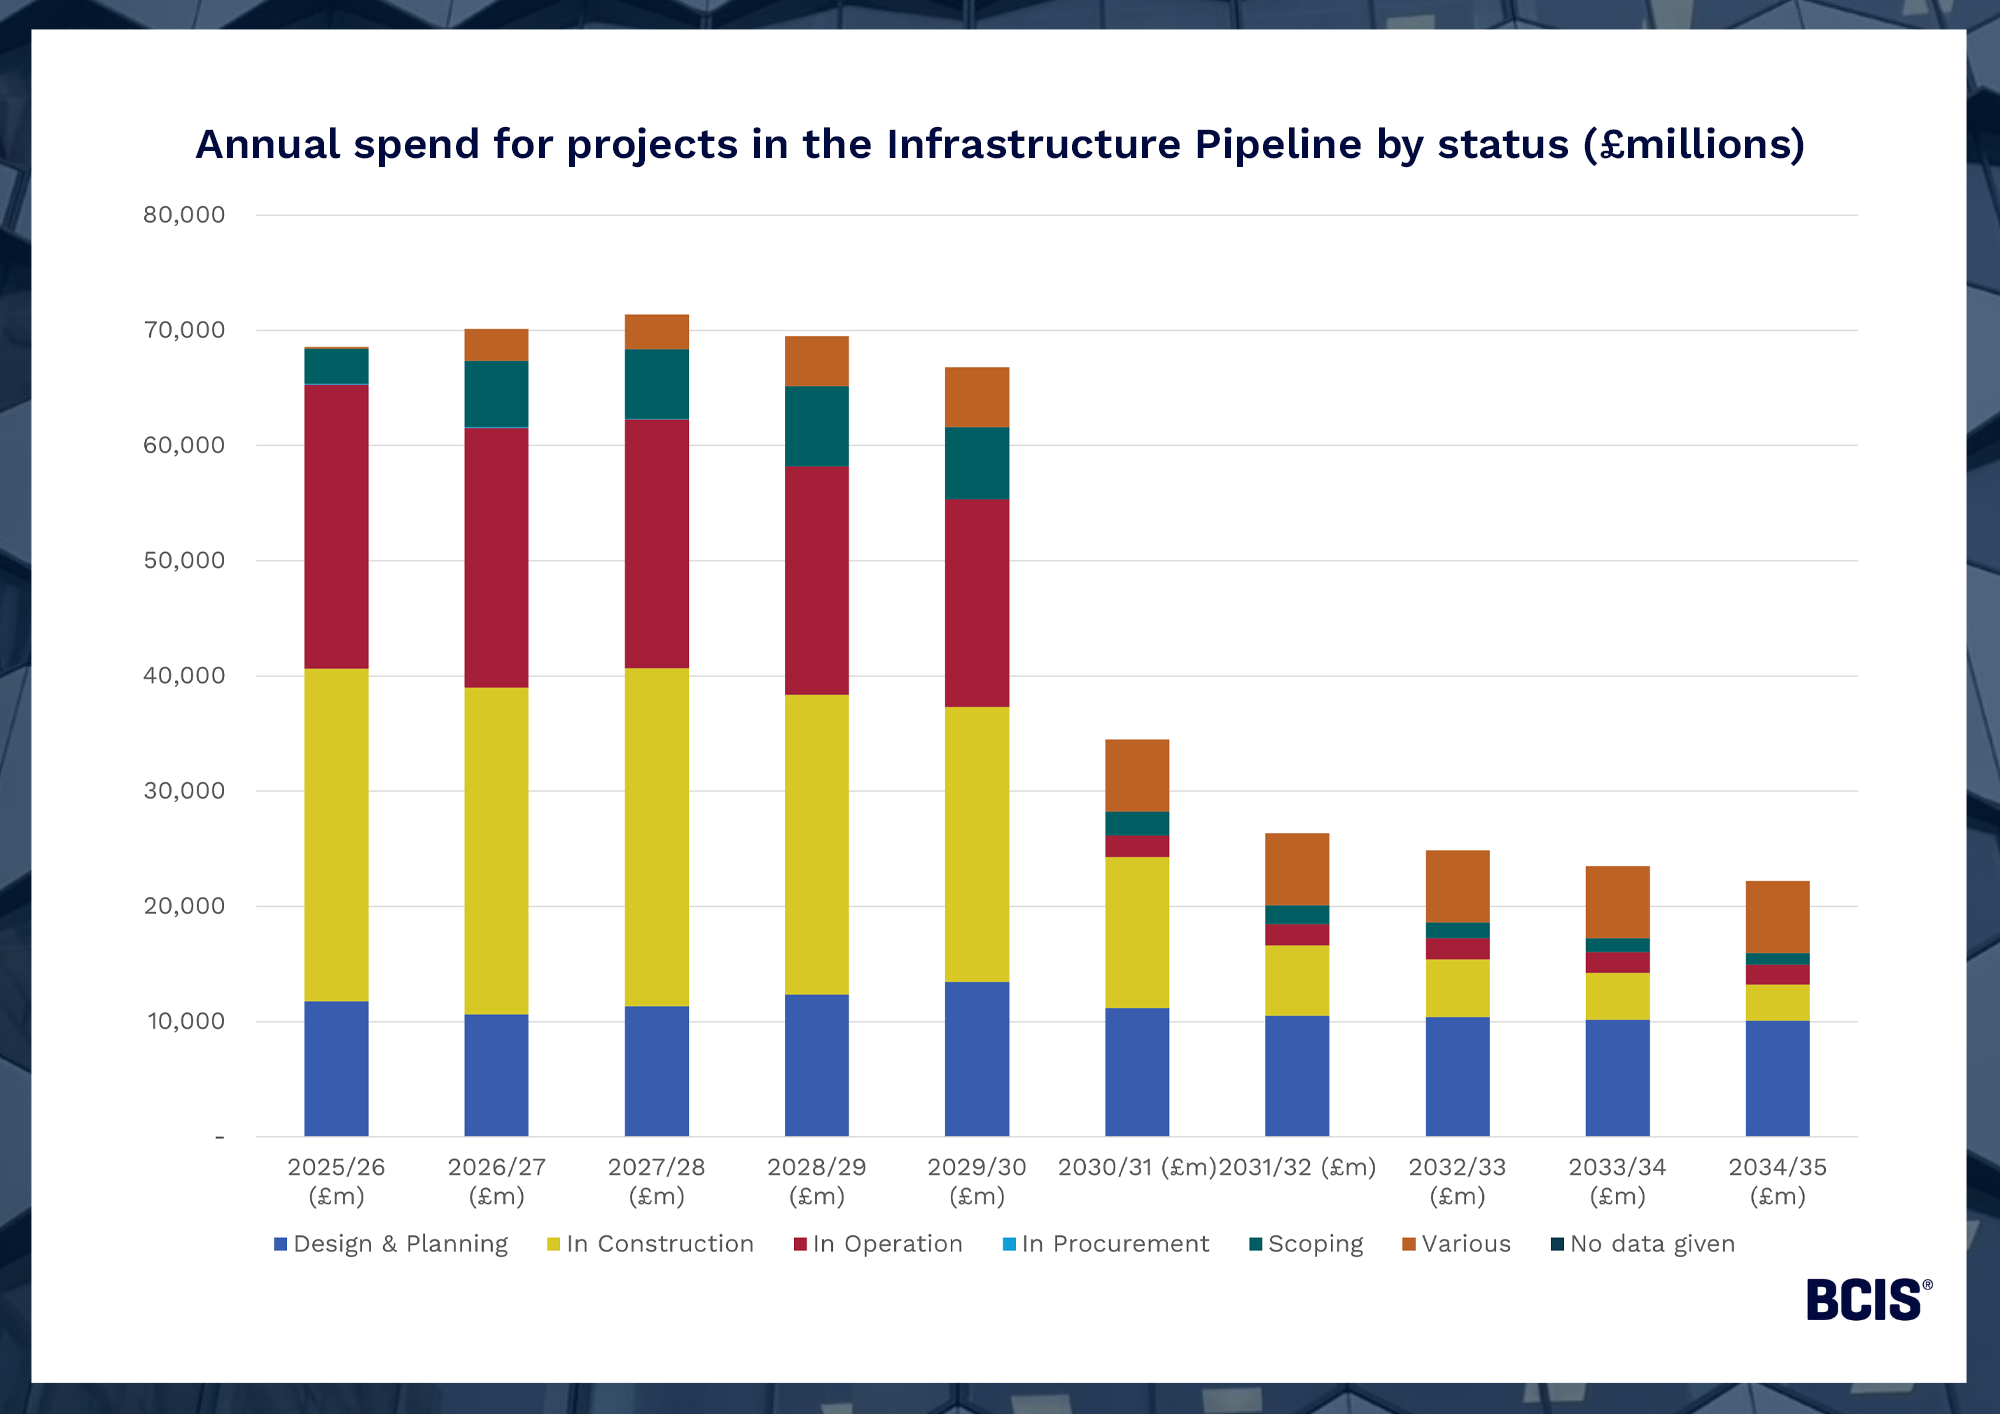
The pipeline gives a good indication of projects’ construction and procurement status too.
Around one-quarter of the 994 projects have been procured. One-fifth are at the design and planning stage while 187 (19%) are in construction.
Source: NISTA
As it stands, the pipeline provides a list of projects, but there’s no getting around the fact that when it comes to costs and investment opportunities, the pipeline is very much a work in progress.
For example, the total capital cost for more than half (529) of the 994 projects is unknown.
Some data may not be provided because projects have already finished or because projects in initiatives such as the New Hospital Programme and School Rebuilding Programme have been combined. Breaking down these initiatives into project-level costs would be more helpful for the supply chain’s capacity planning.
NISTA has promised to update the pipeline every six months with the next refresh occurring in early 2026 but given the substantial omission of data, this feels too late to be useful.
There is an urgent economic need for greater private sector investment in construction that largely depends on the level of granular detail in the pipeline.
While the government has confirmed that more than half (£285 billion) of the £531 billion earmarked for the pipeline will be funded solely by the public sector(1), rising public borrowing costs and interest debt continue to squeeze government coffers.
Current estimates suggest the Chancellor will need to find an additional £25 billion in the Autumn Budget to address the fiscal black hole, while the National Institute of Economic and Social Research has predicted that the government is on track to miss the Chancellor’s self-imposed borrowing rules by £41.2 billion(2).
Under these circumstances, the public sector funding half of the pipeline is ambitious at best.
There’s a good chance the government will have to rely on the private sector far more than anticipated, in which case, the sooner the pipeline is fully fleshed out, the better.
The Treasury has allegedly hinted that more data on projects will be added once government departments have completed post-spending review business planning work(3). Privately financed social infrastructure projects that are not currently included in the pipeline may also be added once their status is confirmed.
However, there’s no certainty over when these additions will happen or indeed the extent to which current cost gaps will be filled.
So, where does this leave us?
The major issue is the enormity of the task ahead for NISTA. There’s no question it has delivered a list of potential projects which could in time develop into a real-time pipeline but its ability to upload data at the speed required is not guaranteed and will depend on its capacity.
The priority, according to BCIS chief economist, Dr David Crosthwaite, is a clarification of project funding mechanisms and an indication of the probability that projects will actually get to procurement.
There’s already talk about the possibility of some projects being cancelled in an attempt to balance the public finances. If that happens, the credibility of the pipeline will be drawn into question before it has really got off the ground.
After all, the pipeline is supposed to be an early indication of proposed projects to allow for capacity planning. If there’s no confidence in the content of the pipeline, there’s a risk it will become futile.
To keep up to date with the latest industry news and insights from BCIS, register for our newsletter here.
Share on social media
![]()