Published: 15/01/2021
According to a recent study, UK construction costs are among the most expensive in Europe when calculated in Euros.
The Council of European Construction Economists (CEEC*) carries out an exercise each year to compare construction costs between countries. BCIS contributes UK costs to the study on behalf of RICS.
Participating members price a standard office block model, developed to allow comparisons of construction costs between the member countries. The model is based on a set of agreed measurements and quantities, which reflect the key materials/structure of a typical office building. The costs include an allowance for external works, preliminaries and contingencies.
The results for June 2020 are given in the chart below.
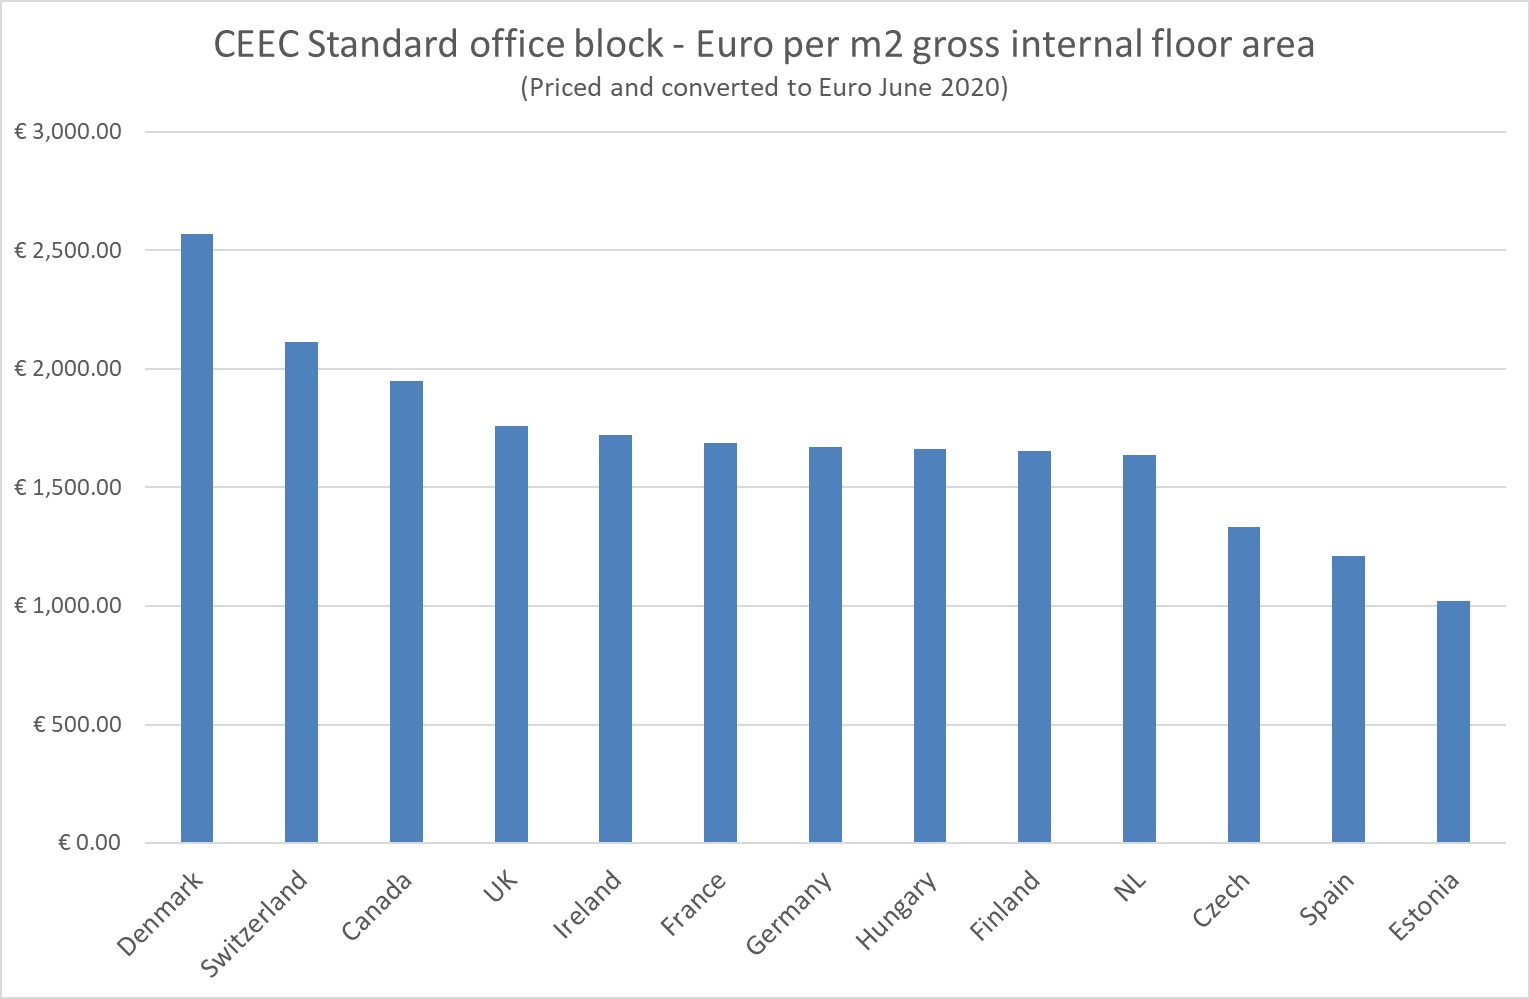
Full details of the office cost model and a breakdown of the costs over the past seven years are available on the CEEC.
CEEC office cost model comparisons are expressed in Euros using exchange rates at the time the study was carried out (June 2020). Exchange rates, particularly Sterling, have been volatile in recent years against the backdrop of the UK’s negotiations to exit the EU.
The movement and fluctuation of exchange rates tends to distort how one country’s construction costs compare with another’s. BCIS has therefore compared the costs directly in the table below. The conversion factors are derived by dividing the costs, in local currencies, by the costs in a single country, also in local currency. The results are building cost exchange rates usually referred to as purchasing power parities (PPP). The PPPs are affected by any differential movement in construction costs between countries but not directly by fluctuations in exchange rates.
A known cost in one country can be expressed in equivalent cost in another country by multiplying by the factors in the columns (or dividing by the factors in the rows).
For example, a project costing 10 million Kroner in Denmark would cost 1.36 million Swiss Francs in Switzerland,1.76 million Canadian dollars in Canada, £880,000 in the UK, etc.
Purchasing power parities for construction works based on the CEEC office cost model June 2020:
| Denmark | Switzerland | Canada | UK | Ireland | France | Germany | ||
| DKK | CHF | CAD | GDP | Euro | Euro | Euro | ||
| Denmark | DKK | 1 | 8.20 | 6.31 | 12.64 | 11.15 | 11.37 | 11.49 |
| Switzerland | CHF | 0.122 | 1 | 0.77 | 1.54 | 1.36 | 1.39 | 1.40 |
| Canada | CAD | 0.158 | 1.30 | 1 | 2.00 | 1.77 | 1.80 | 1.82 |
| UK | GDP | 0.079 | 0.65 | 0.50 | 1 | 0.88 | 0.90 | 0.91 |
| Ireland | Euro | 0.090 | 0.74 | 0.57 | 1.13 | 1 | 1.02 | 1.03 |
| France | Euro | 0.088 | 0.72 | 0.56 | 1.11 | 0.98 | 1 | 1.01 |
| Germany | Euro | 0.087 | 0.71 | 0.55 | 1.10 | 0.97 | 0.99 | 1 |
| Hungary | HUF | 31.0 | 254.2 | 195.4 | 391.5 | 345.4 | 352.1 | 356.0 |
| Finland | Euro | 0.086 | 0.71 | 0.54 | 1.09 | 0.96 | 0.98 | 0.99 |
| Netherlands | Euro | 0.085 | 0.70 | 0.54 | 1.08 | 0.95 | 0.97 | 0.98 |
| Czechia | CZK | 1.850 | 15.18 | 11.67 | 23.39 | 20.63 | 21.03 | 21.26 |
| Spain | Euro | 0.063 | 0.52 | 0.40 | 0.80 | 0.70 | 0.72 | 0.72 |
| Estonia | Euro | 0.053 | 0.44 | 0.34 | 0.67 | 0.59 | 0.61 | 0.61 |
| Hungary | Finland | Netherlands | Czechia | Spain | Estonia | ||
| HUF | Euro | Euro | CZK | Euro | Euro | ||
| Denmark | DKK | 0.323 | 11.61 | 11.72 | 0.5404 | 15.85 | 18.78 |
| Switzerland | CHF | 0.0039 | 1,42 | 1.43 | 0.0659 | 1.93 | 2.29 |
| Canada | CAD | 0.0051 | 1.84 | 1.86 | 0.0857 | 2.51 | 2.98 |
| UK | GDP | 0.0026 | 0.92 | 0.93 | 0.0428 | 1.25 | 1,49 |
| Ireland | Euro | 0.0029 | 1.04 | 1.05 | 0.0485 | 1.42 | 1.68 |
| France | Euro | 0.0028 | 1.02 | 1.03 | 0.0475 | `1.39 | 1.65 |
| Germany | Euro | 0.0028 | 1.01 | 1.02 | 0.0470 | 1.38 | 1.63 |
| Hungary | HUF | 1 | 359.7 | 363.0 | 16.74 | 491.1 | 581.8 |
| Finland | Euro | 0.0028 | 1 | 1.01 | 0.0465 | 1.37 | 1.62 |
| Netherlands | Euro | 0.0028 | 0.99 | 1 | 0.0461 | 1.35 | 1.60 |
| Czechia | CZK | 0.0597 | 21.49 | 21.68 | 1 | 29.33 | 34.75 |
| Spain | Euro | 0.0020 | 0.73 | 0.74 | 0.0341 | 1 | 1.18 |
| Estonia | Euro | 0.0017 | 0.62 | 0.62 | 0.0288 | 0.84 | 1 |
The UK costs are based on BCIS Data.
*Conseil European des Economistes de la Construction (CEEC) was formed 40 years ago by the representatives of various national institutions representing construction economics in their own countries, with the aim of promoting the profession at a European level. RICS was a founding member of CEEC and BCIS provides technical input to projects and standards.