BCIS CapX includes price adjustment formulae, a method of calculating the increase, or decrease, in contractors’ costs over any period. The formulae and indices (over 200 of them) are widely used in various sectors in the construction industry, including civil engineering contracts and facility management.
Published: 17/07/2026
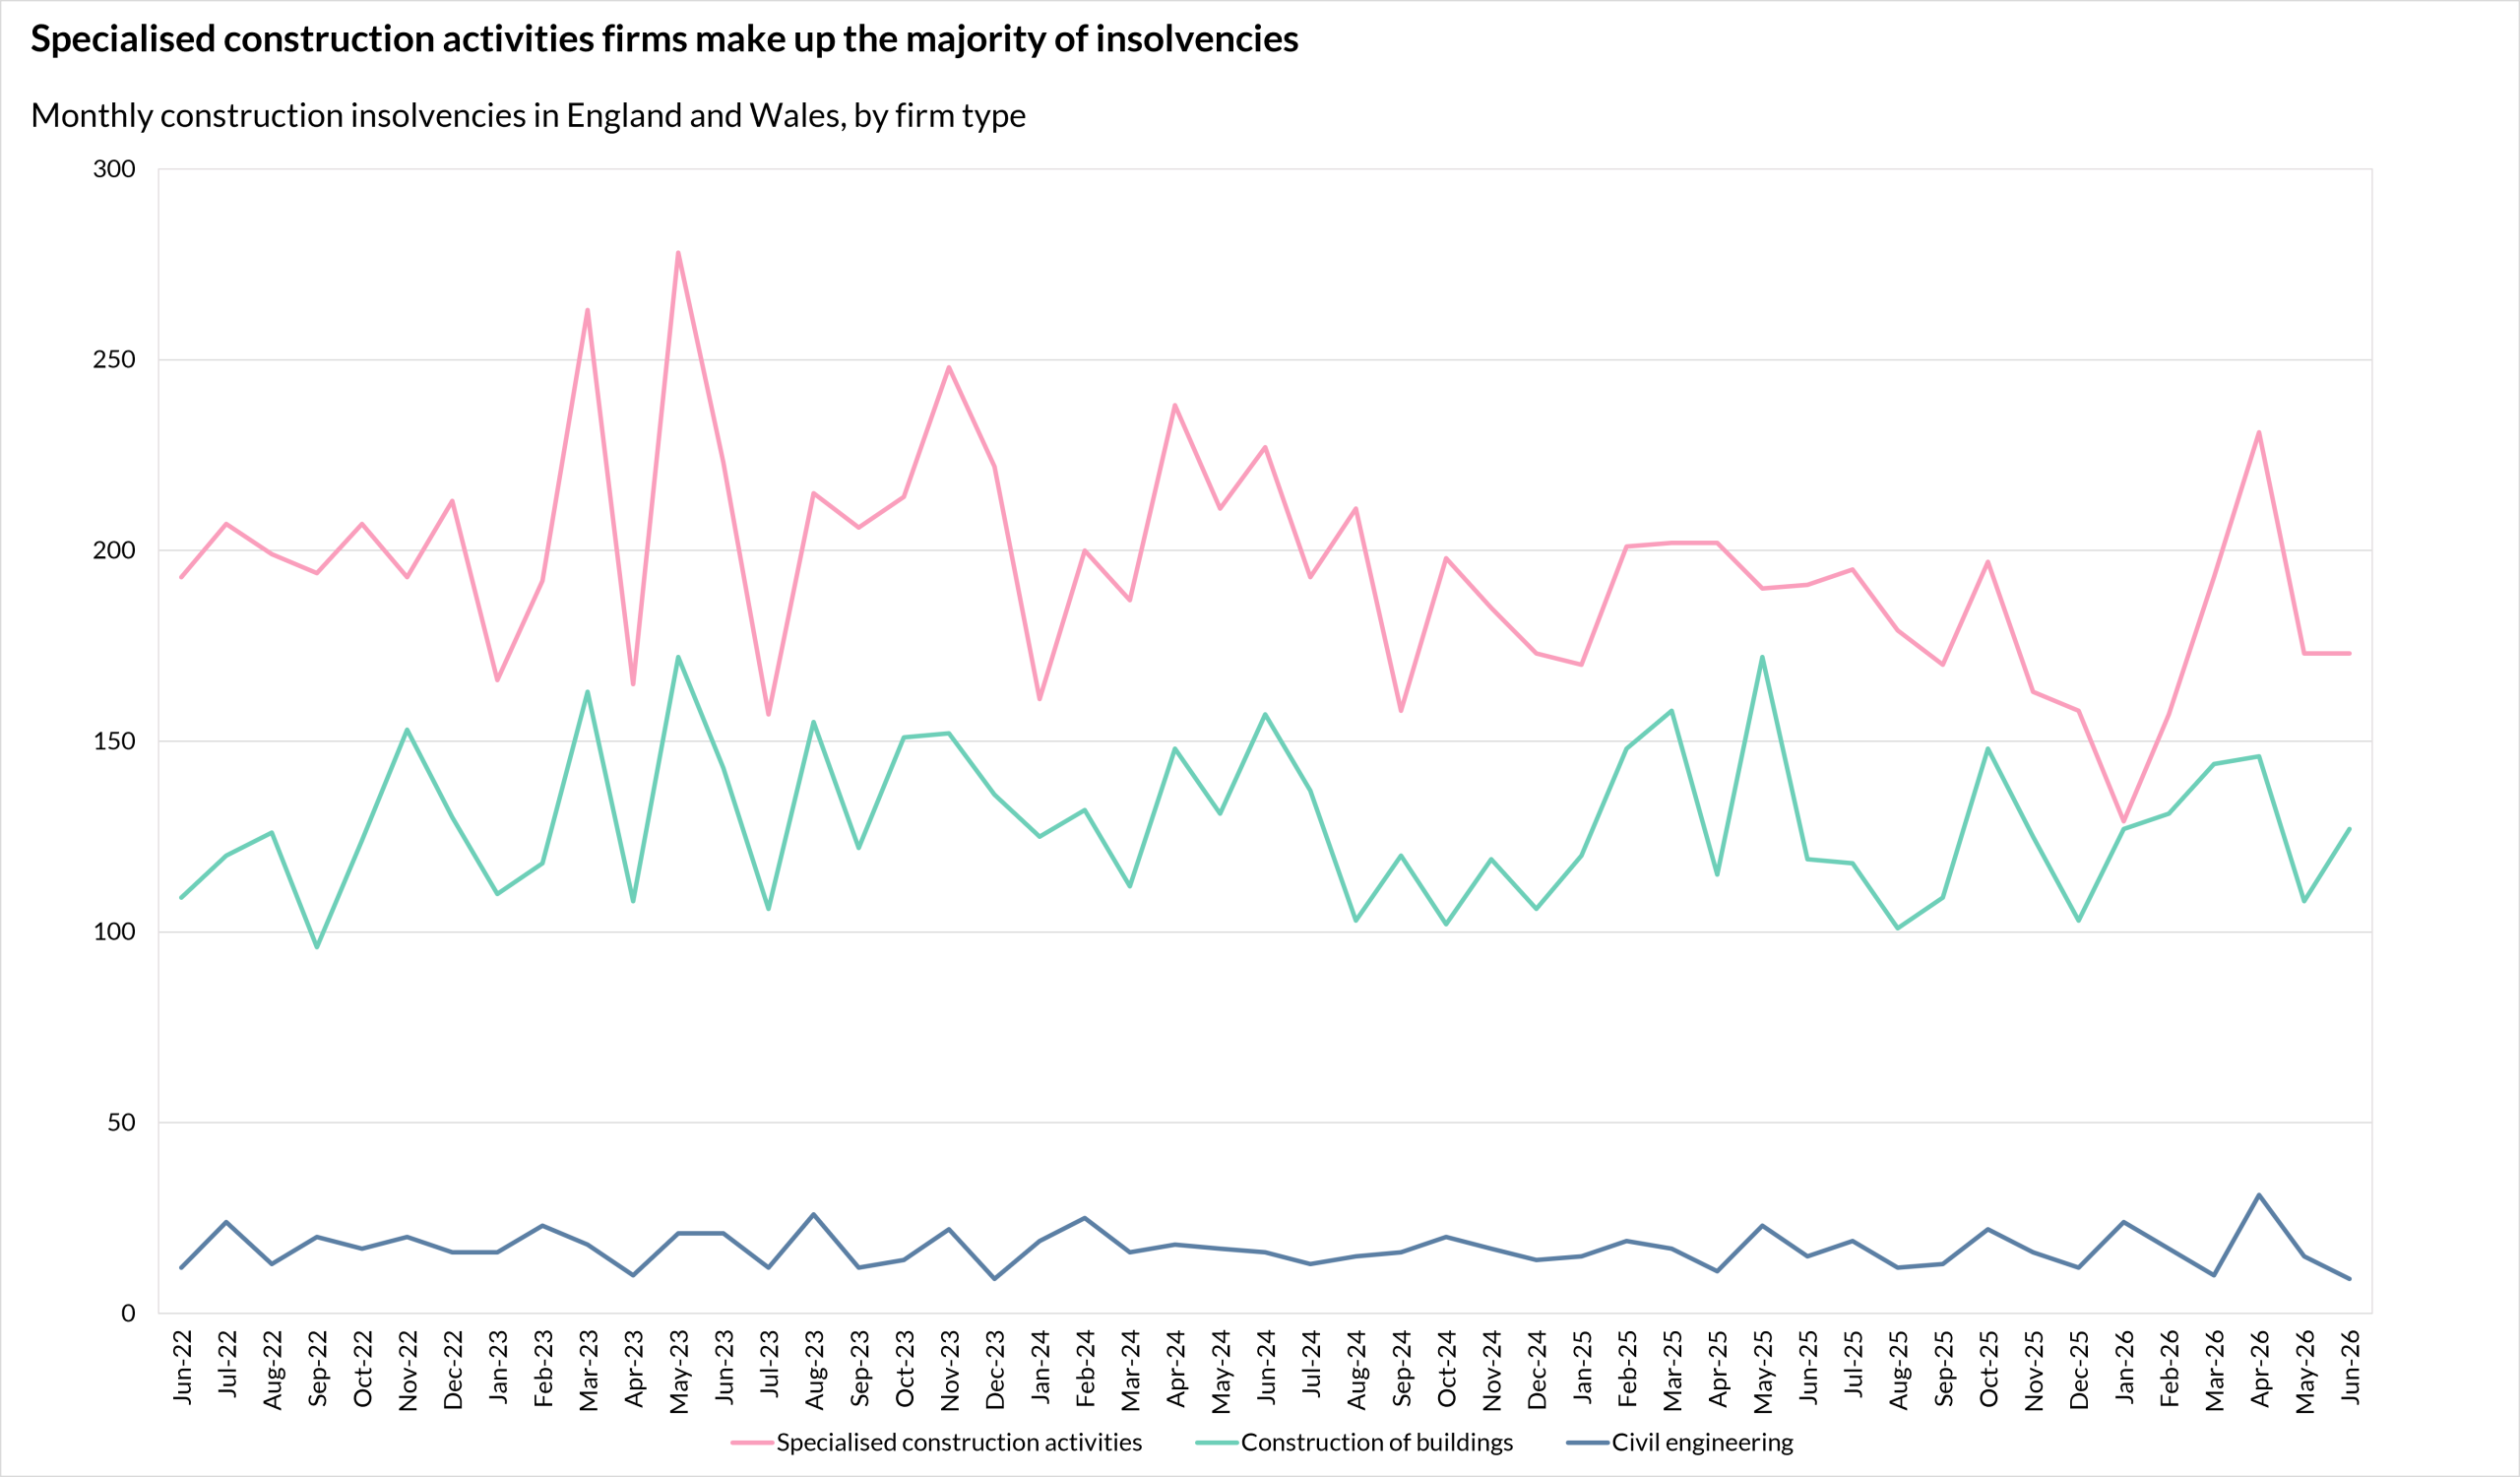
Construction firms accounted for 16% of all insolvencies in England and Wales in June 2026, according to The Insolvency Service(1), with 309 registered construction businesses becoming insolvent.
This was 13 more than those recorded in May 2026 but 16 fewer than the 325 in June 2025.
By comparison, construction firms accounted for 14%(2) of all registered businesses in the UK as of September 2025.
The largest proportion of construction insolvencies were among firms providing specialised construction activities with 173 recorded in June.
The total number of construction firms becoming insolvent in the 12 months to June 2026 was 3,805. This was a 5% decrease on the 3,988 insolvencies recorded in the year ending in June 2025 but an 18% increase on the 3,221 in pre-pandemic 2019.
Source: The Insolvency Service – Company Insolvency Statistics June 2026, Table 1c
Dr David Crosthwaite, chief economist at BCIS, said: ‘Construction insolvencies remain above pre-pandemic levels, but what’s notable about the latest data is that the first half of 2026 recorded fewer insolvencies than any equivalent period since 2022. While this is only a snapshot, it suggests that, even in light of recent developments involving the US and Iran, the conflict has not yet had a significant, long-term impact on construction business insolvencies beyond normal levels. The exception was the 408 insolvencies recorded in April 2026.
‘That said, these effects often take time to feed through. With peace efforts having broken down, any prolonged disruption could have implications for construction businesses in the months ahead. The main risks are a continued softening of demand and rising input cost inflation, both of which could squeeze cash flow and leave smaller businesses particularly vulnerable.’
Across all industry sectors, construction experienced the highest number of insolvencies in the year to June 2026.
The Insolvency Service said that while the insolvency rate has increased since the lows seen in 2020 and 2021, it remains much lower than the peak of 113.1 per 10,000 companies seen during the 2008-09 recession. This is because the number of companies on the effective register has more than doubled over this period. The rate in the year to the end of June 2026 was 50.5 per 10,000 companies(3).
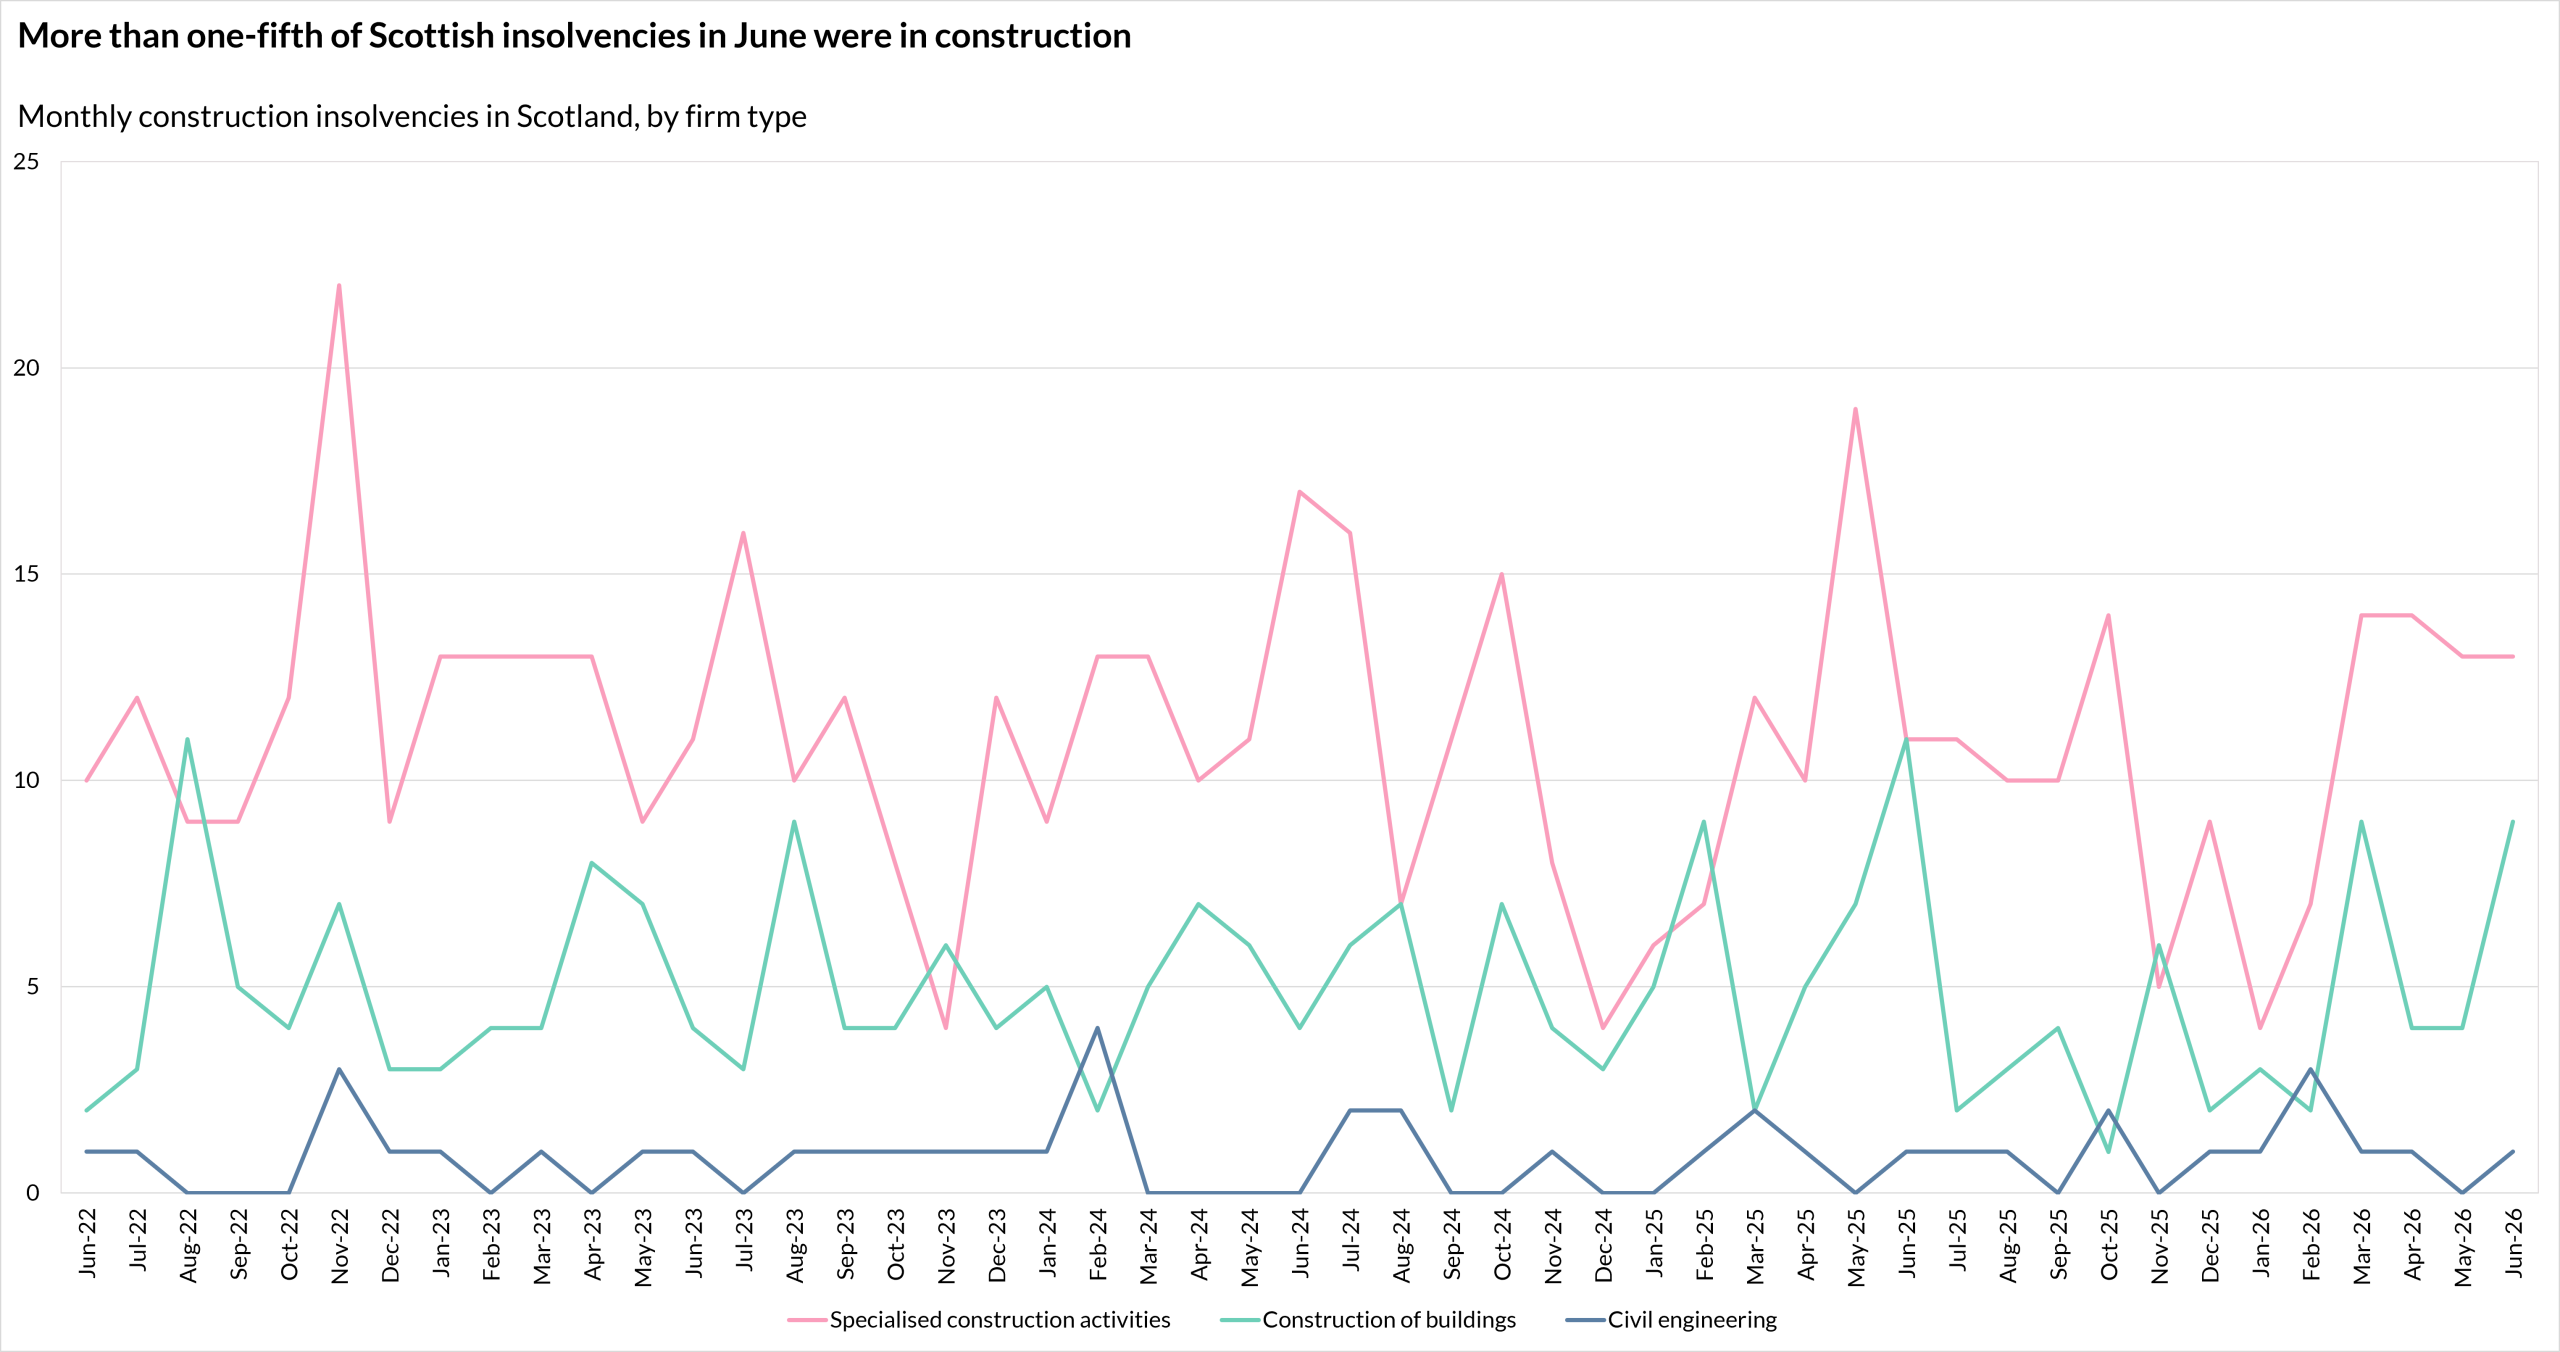
In Scotland, there were 23 construction company insolvencies in June 2026, six more than in May 2026, accounting for 22% of all insolvencies in the country.
The number of Scottish construction insolvencies for the 12-month period to June 2026 was 185, 19 less than the 204 in the year to June 2025, and an 11% decrease on the 207 in pre-pandemic 2019.
Source: The Insolvency Service – Company Insolvency Statistics June 2026, Table 4b
Within the industry, firms classified as providing specialised construction activities are consistently the most affected across Great Britain. However, analysis shows that their numbers are proportional to their overall share within the construction sector.
This category includes companies providing a range of work, typically on a subcontract basis, from demolition and site preparation to electrical and plumbing installation, and finishing work like plastering, painting and glazing.
The Insolvency Service also publishes figures for Northern Ireland, but not with sector breakdowns.
The latest analysis of profit warnings issued by listed construction companies by EY-Parthenon suggests that housebuilders in particular are facing difficult trading conditions.
FTSE Household Goods and Home Construction firms, which include housebuilders, issued six warnings in 2Q2026, bringing the sector’s total to ten in the first half of the year.
Commentary pointed to the combined weight of higher energy and input costs, weaker consumer confidence and fading expectations of near-term interest rate cuts. EY-Parthenon also reported that measures to stimulate sales, including mortgage contributions, deposit support and part-exchange schemes, have come at the expense of profit margins.
A multitude of factors feed into company insolvency, though analysis of profit warning data by EY suggests the construction industry is particularly exposed to financial difficulty.
This is in part due to the nature of contract cycles and the challenges of cash flow management that contractors and subcontractors are subject to.
An effective way of mitigating the risks associated with fixed-price contracts when costs are so changeable is to use fluctuation clauses linked to work category and resource-specific inflation indices, such as those available in BCIS CapX.
BCIS Price Adjustment Formulae Indices (PAFI), covering more than 200 work activities across building, civil engineering, specialist engineering and highways maintenance, can also be used throughout the budgeting and procurement stages to plan cash flow more effectively.
To keep up to date with the latest industry news and insights from BCIS, register for our newsletter here.