If you are a housebuilder or developer, please fill in the survey. If you have any questions or would like to discuss the survey, please call +44 0330 341 1000 or email contactbcis@bcis.co.uk
Published: 19/10/2026
Each month, Lloyds, Nationwide and HM Land Registry publish house price indices, tracking the movement in average house prices in the UK. Lloyds and Nationwide updates are based on mortgage approvals data, while the UK House Price Index (HPI) is a joint production by HM Land Registry, Land and Property Services Northern Ireland, ONS and Registers of Scotland.
The Halifax House Price Index was renamed the Lloyds House Price Index in July 2026. The methodology is unchanged and the index is already based on both Halifax and Lloyds mortgage data. Lloyds and Nationwide use their own mortgage approvals data. The UK HPI uses completed sales, including cash purchases. All data used below is seasonally adjusted.
House prices remained subdued at quarter’s end
UK house price growth remained muted in September, with the latest indices pointing to a mixed picture across the housing market. Lloyds(1) reported no growth in house prices in the year to September 2026 or between August and September. Meanwhile, Nationwide’s index(2) recorded annual growth of 0.8% but a monthly contraction of 0.2%.
The figures arrived as Bank of England data revealed net mortgage approvals for house purchases decreased to 54,900 in August 2026, below an average of around 60,100 over the previous 6 months(3).
Earlier data from the Financial Conduct Authority(4), which collects mortgage lending data via the Mortgage Lending and Administration Return, revealed that the value of new mortgage commitments (lending agreed to be advanced in the coming months) increased by 1.4% in 2Q2026 from the previous quarter to £79.2 billion and was 1.3% higher than a year earlier.
Dr David Crosthwaite, chief economist at BCIS, said: ‘The housing market has been caught in a prolonged cycle of subdued price growth, weak demand and reduced housebuilding activity. While wage growth outpacing house price inflation has helped ease some affordability pressures, significant challenges remain.
‘According to financial information service, Moneyfacts, the average five-year fixed mortgage rate reached 6% in early October for the first time in three years as financial markets anticipate Bank Rate increases. The risks remain skewed to the upside, given the ongoing uncertainty surrounding the US-Iran conflict and its potential impact on Bank Rate and mortgage affordability.
‘Government intervention at the Autumn Budget would therefore be welcome. While we expect further details on the Your First Home scheme, additional targeted measures to support buyers, address rising development costs and create more favourable conditions for homeowners and developers alike would help strengthen the market.
‘Any further weakening in buyer demand risks discouraging developers from investing in new housing at a time when greater activity is urgently needed.
‘The consequences could extend well beyond the housing market, further restricting access to housing, putting the government’s housebuilding targets increasingly out of reach with implications for wider economic growth.’
Andrew Asaam, mortgages director at Lloyds, said property prices have so far proved resilient during a period of higher mortgage rates, which has been driven by changing expectations around the future path of the base rate. He added that household spending has also held up better than expected, despite energy and other cost pressures arising from the Middle East conflict.
‘Whether that picture continues is likely to depend on how confident consumers feel that the latest cost‑of living pressures will prove temporary,’ he said. ‘Confidence has long been a key driver of housing market activity, and will play an important role in shaping demand over the remainder of this year and into 2027.’
Nationwide’s chief economist, Robert Gardner, said geopolitical tensions and inflation concerns have stoked financial market expectations of Bank Rate increases. This has maintained upward pressure on the market interest rates which underpin mortgage pricing.
He added: ‘Nevertheless, there have been encouraging signs that higher energy prices are not feeding through to underlying price pressures. In particular, private sector wage growth has remained modest, which should give policymakers breathing space to assess the extent to which tighter policy is necessary to ensure inflation returns sustainably to target.’
The UK HPI(5), with the latest seasonally adjusted data for July 2026, showed a 0.2% decrease on house prices in June 2026.
As the UK HPI figures cover house sales that may have been agreed in months previously, there tends to be a lag in the data.
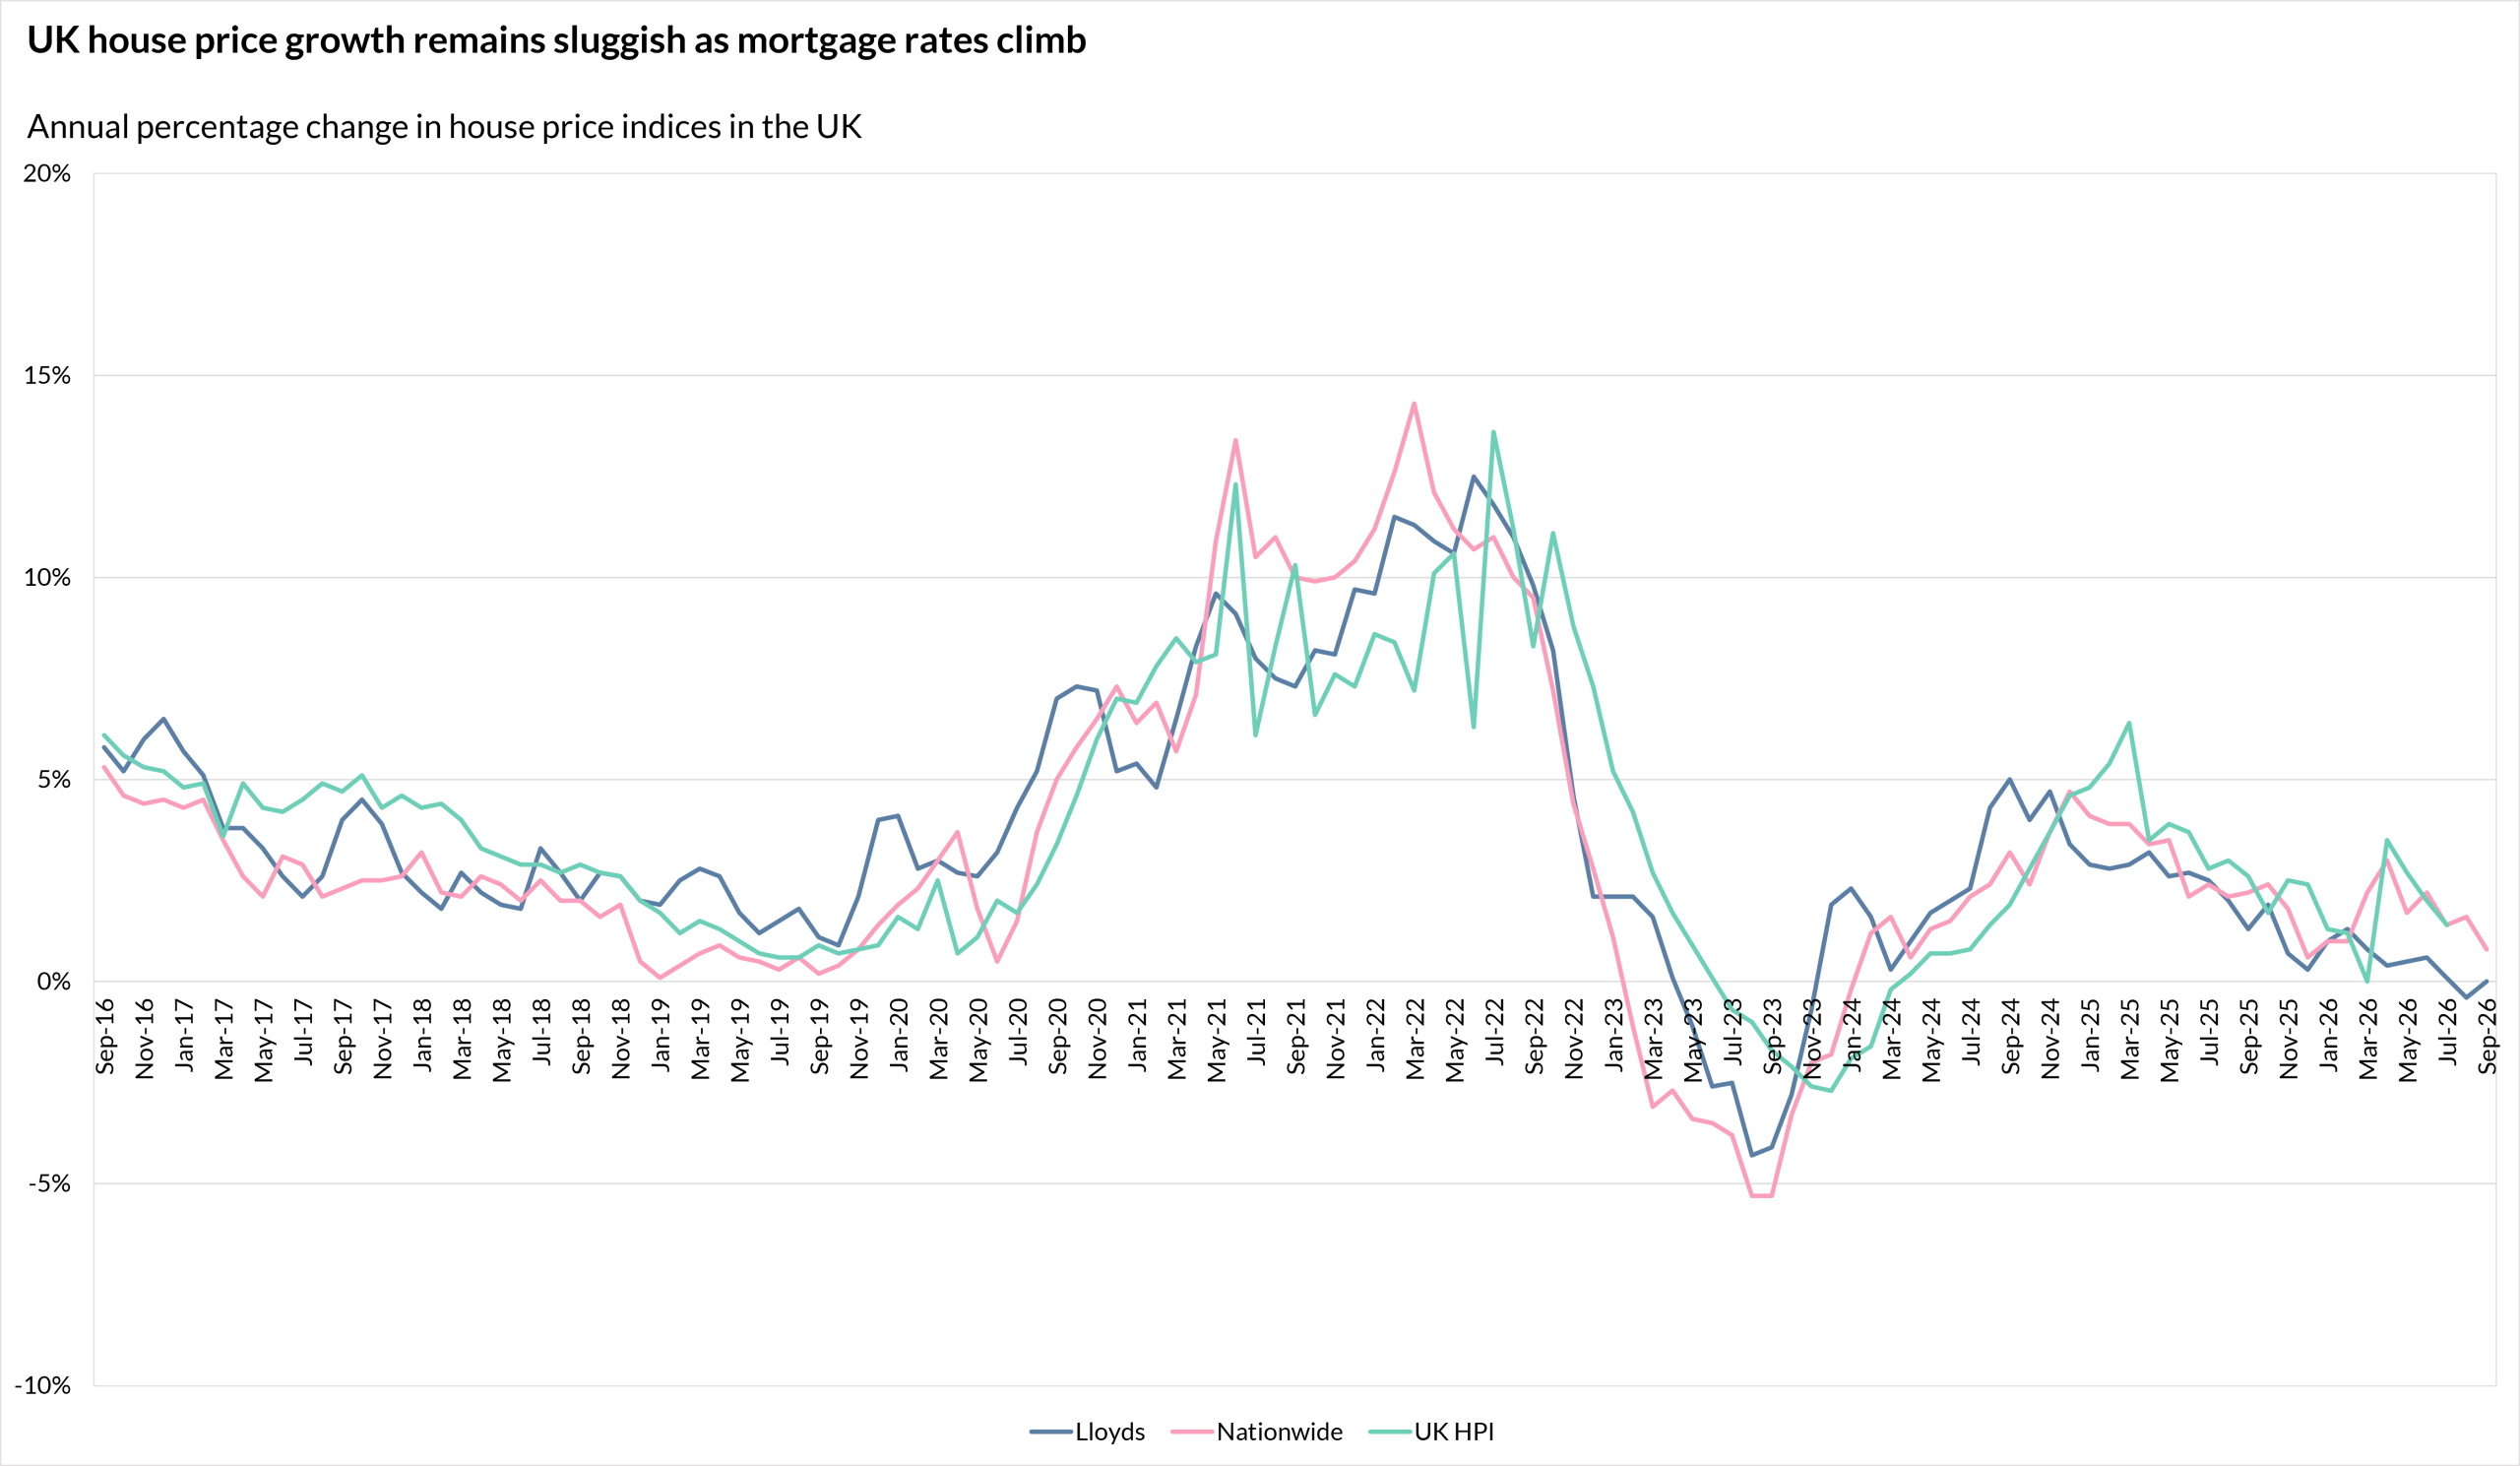
Source: Lloyds (Methodology), Nationwide (Methodology), UK HPI (Methodology)
The latest regional data from Nationwide show Northern Ireland, the North West, Scotland and the North recorded the greatest annual house price growth in 3Q2026.
Northern Irish house prices rose by 5.9% and prices in the North West rose by 3.9%, while Scotland and the North both saw growth of 3.3%.
In 3Q2026, the UK as a whole saw annual house price growth of 1.2% on the same quarter in 2025.
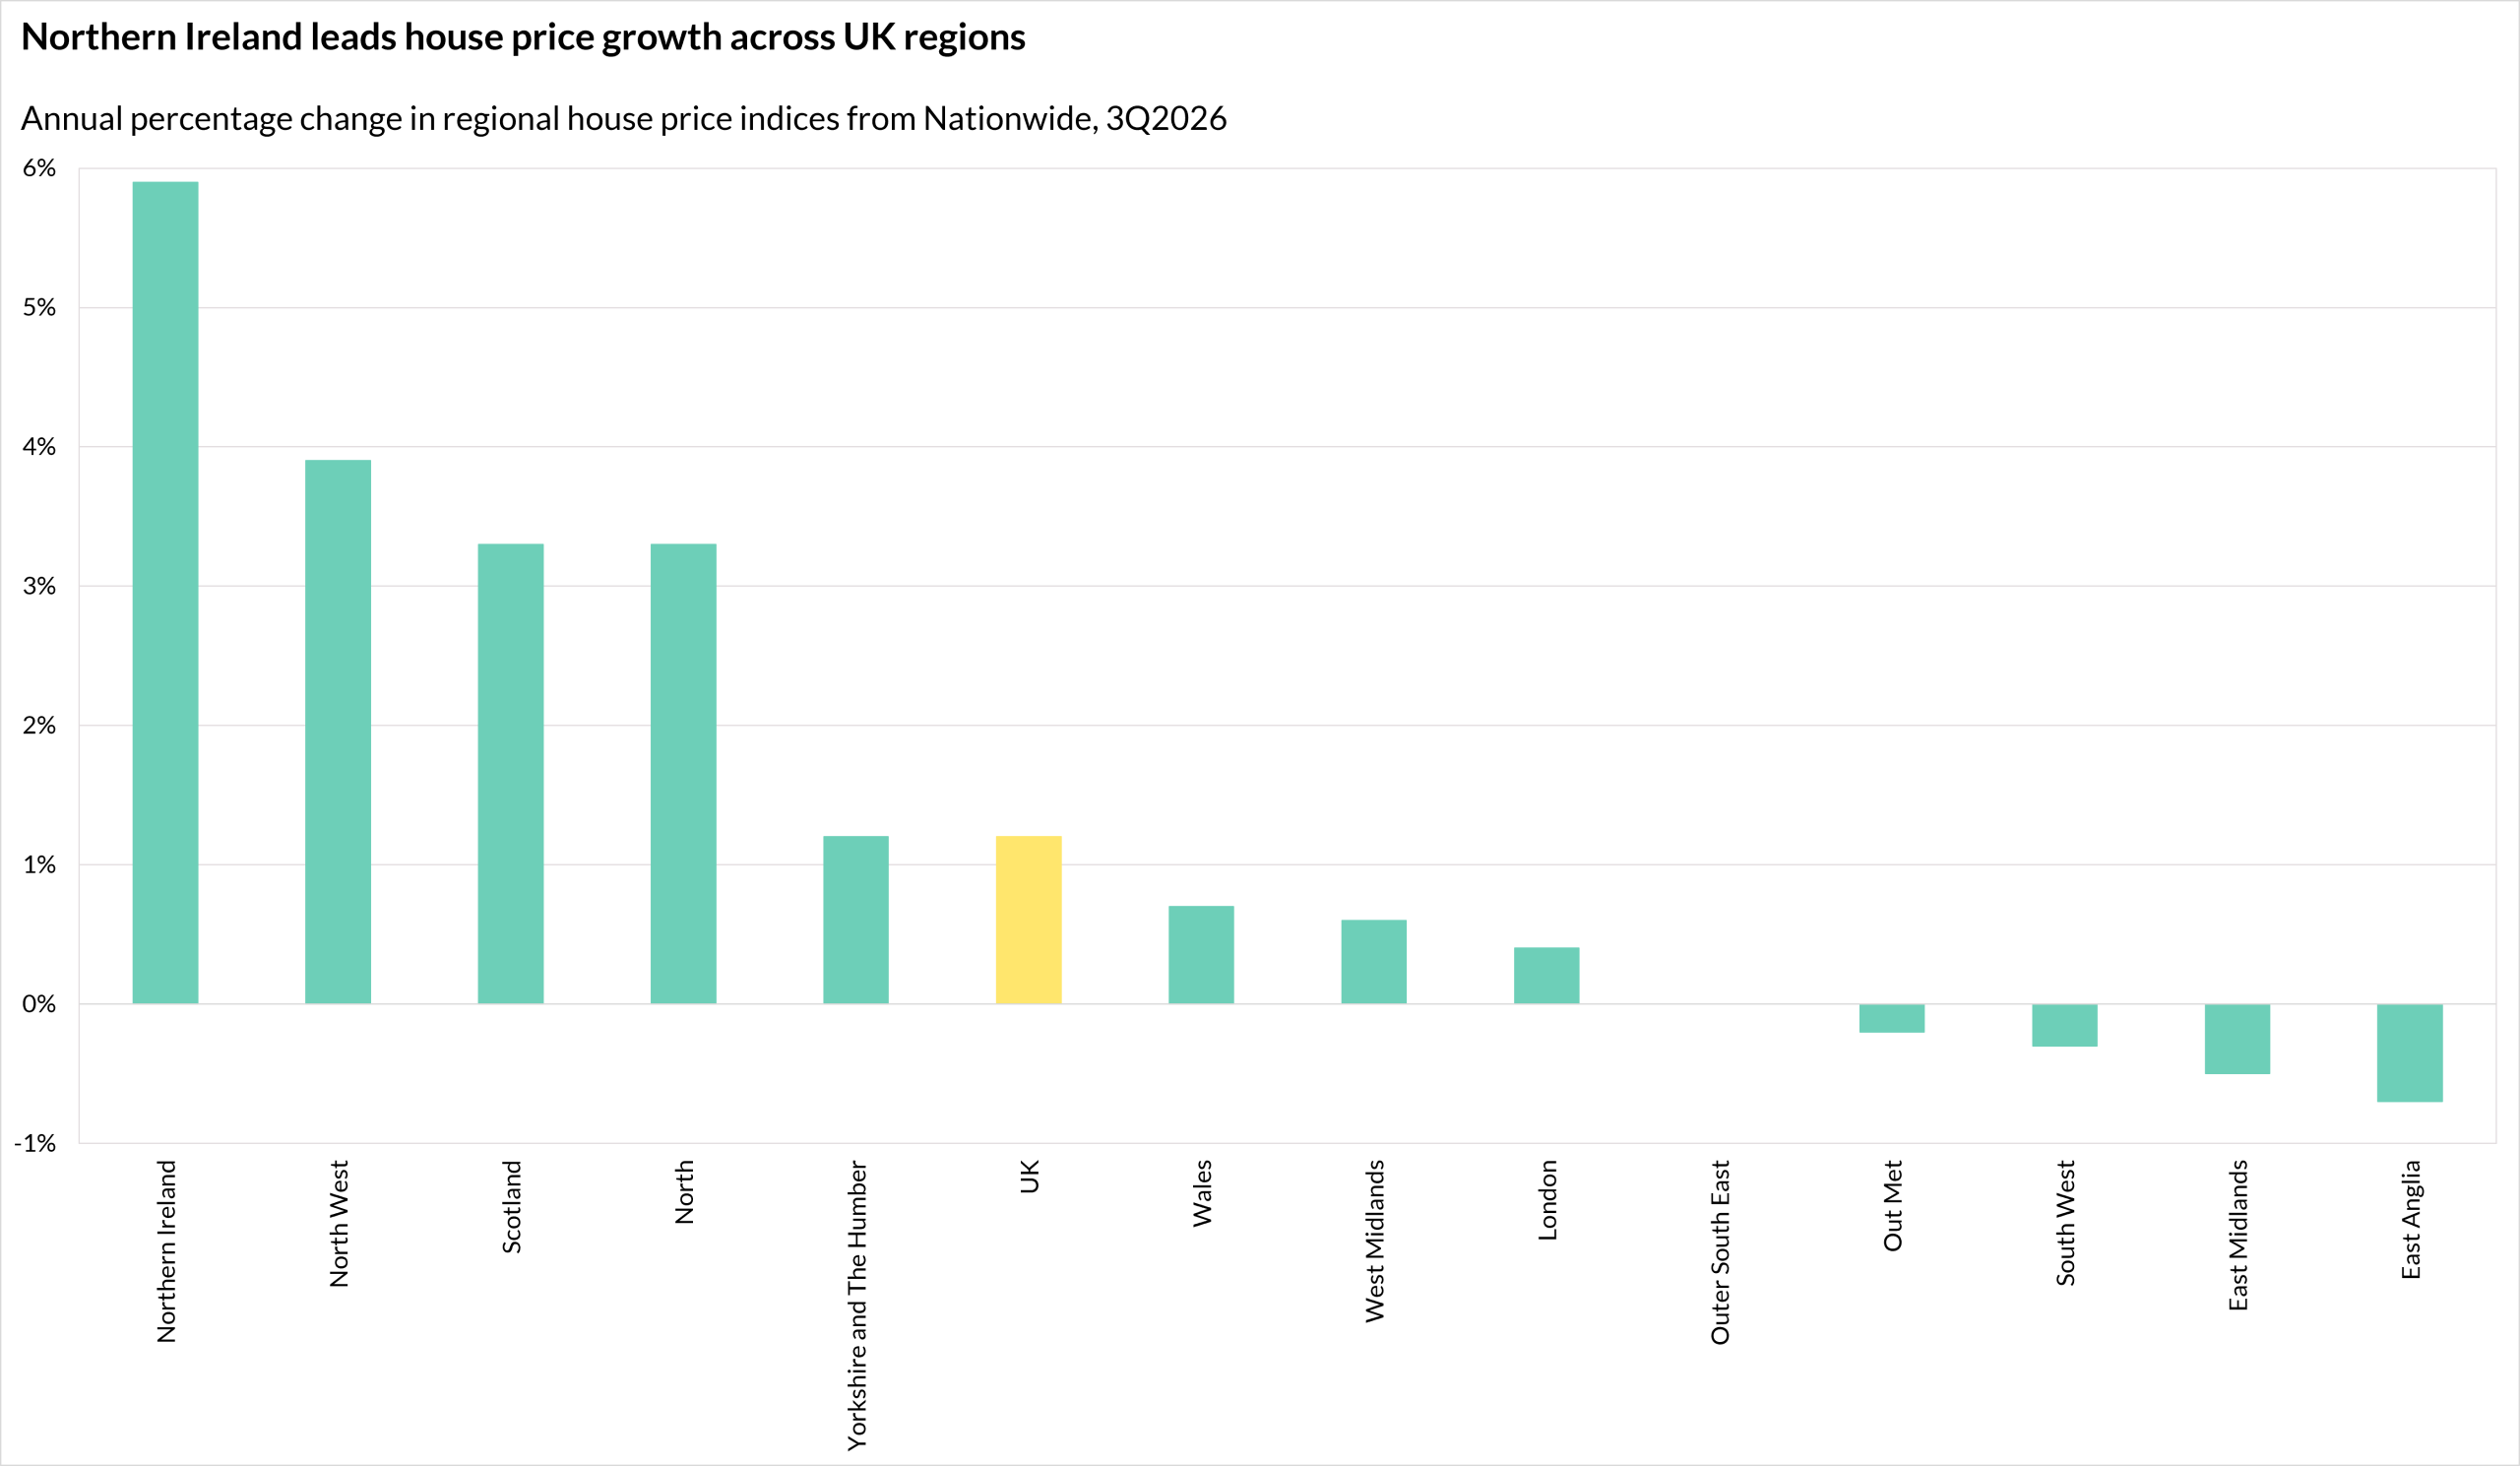
Source: Nationwide – Quarterly Regional House Price Statistics – Q3 2026
To keep up to date with the latest industry news and insights from BCIS, register for our newsletter here.