BCIS CapX provides a comprehensive, detailed and easy-to-use method of measuring cost movement for building and civil engineering. Widely used in the construction and infrastructure sector to help fairly allocate risk between the client and sub-contractors.
Published: 03/07/2026
Each month the Department for Business and Trade (DBT) publishes a selection of building materials and components data for Great Britain including statistics on bricks and concrete blocks production, deliveries and stocks(1).
Brick and block deliveries down as stocks continue to climb
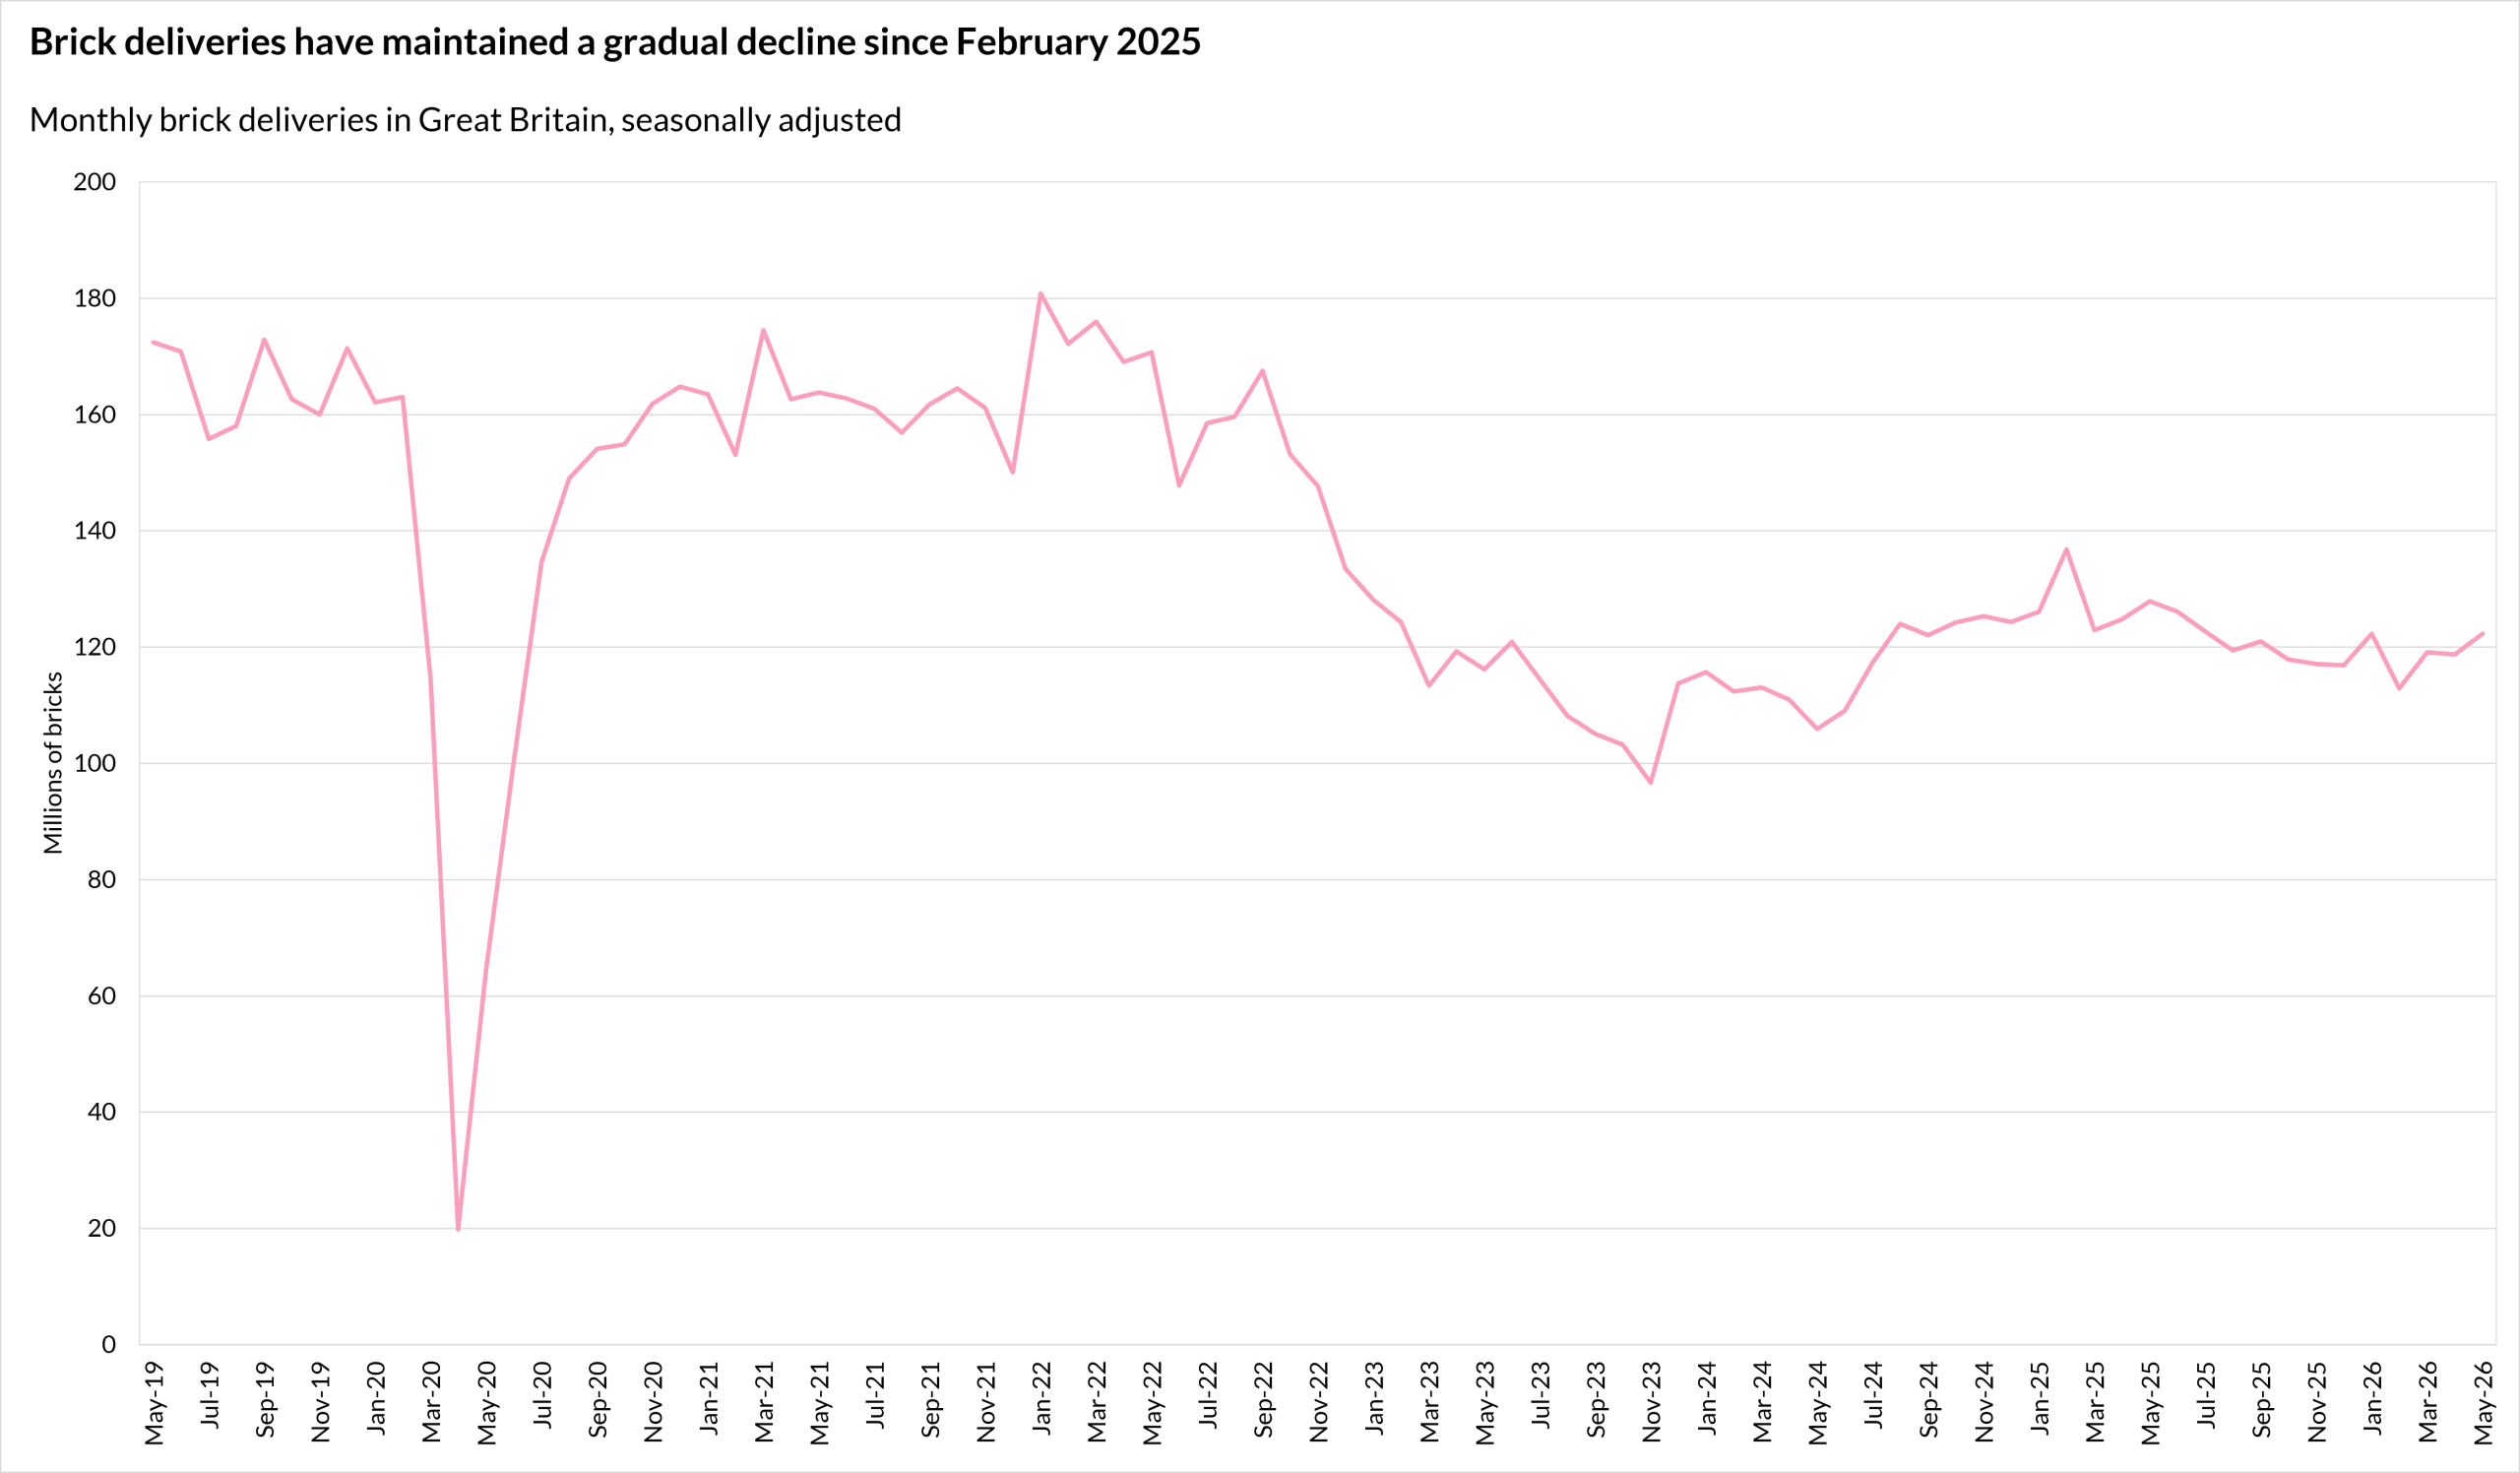
Provisional data published by DBT show brick deliveries (seasonally adjusted) in Great Britain decreased by 4.4% in the 12 months to May 2026. Conversely, deliveries in May were up by 3.0% on April 2026.
Compared with pre-pandemic May 2019, seasonally adjusted brick deliveries in May 2026 were down by 29.1%.
Stocks of all types of bricks at the end of May 2026 stood at 554.3 million, up by 14.7% on the end of May 2025 (483.3 million) and by 43.5% on the level in pre-pandemic May 2019 (386.3 million).
Source: Department for Business and Trade – Building materials and components statistics, Table 9a
DBT’s report also showed concrete block deliveries (seasonally adjusted) in Great Britain were down by 9.1% in the year to May 2026 and by 1.7% on a monthly basis. Compared with May 2019, deliveries were down by 28.3%.
Total stocks of concrete blocks stood at 9.1 million square metres’ worth at the end of May, an increase of 54.4% on May 2025 and 24.3% compared with May 2019.
Elsewhere, DBT data going back to 2013 show a longer-term decline in sand and gravel sales and ready-mixed concrete deliveries (both seasonally adjusted).
In 1Q2026, 9.7 million tonnes of sand and gravel were sold in Great Britain, the lowest level on record, with the exception of 2Q2020. Sales in the first quarter of 2026 were down by 6.6% on the year and by 33.7% compared with pre-pandemic 1Q2019.
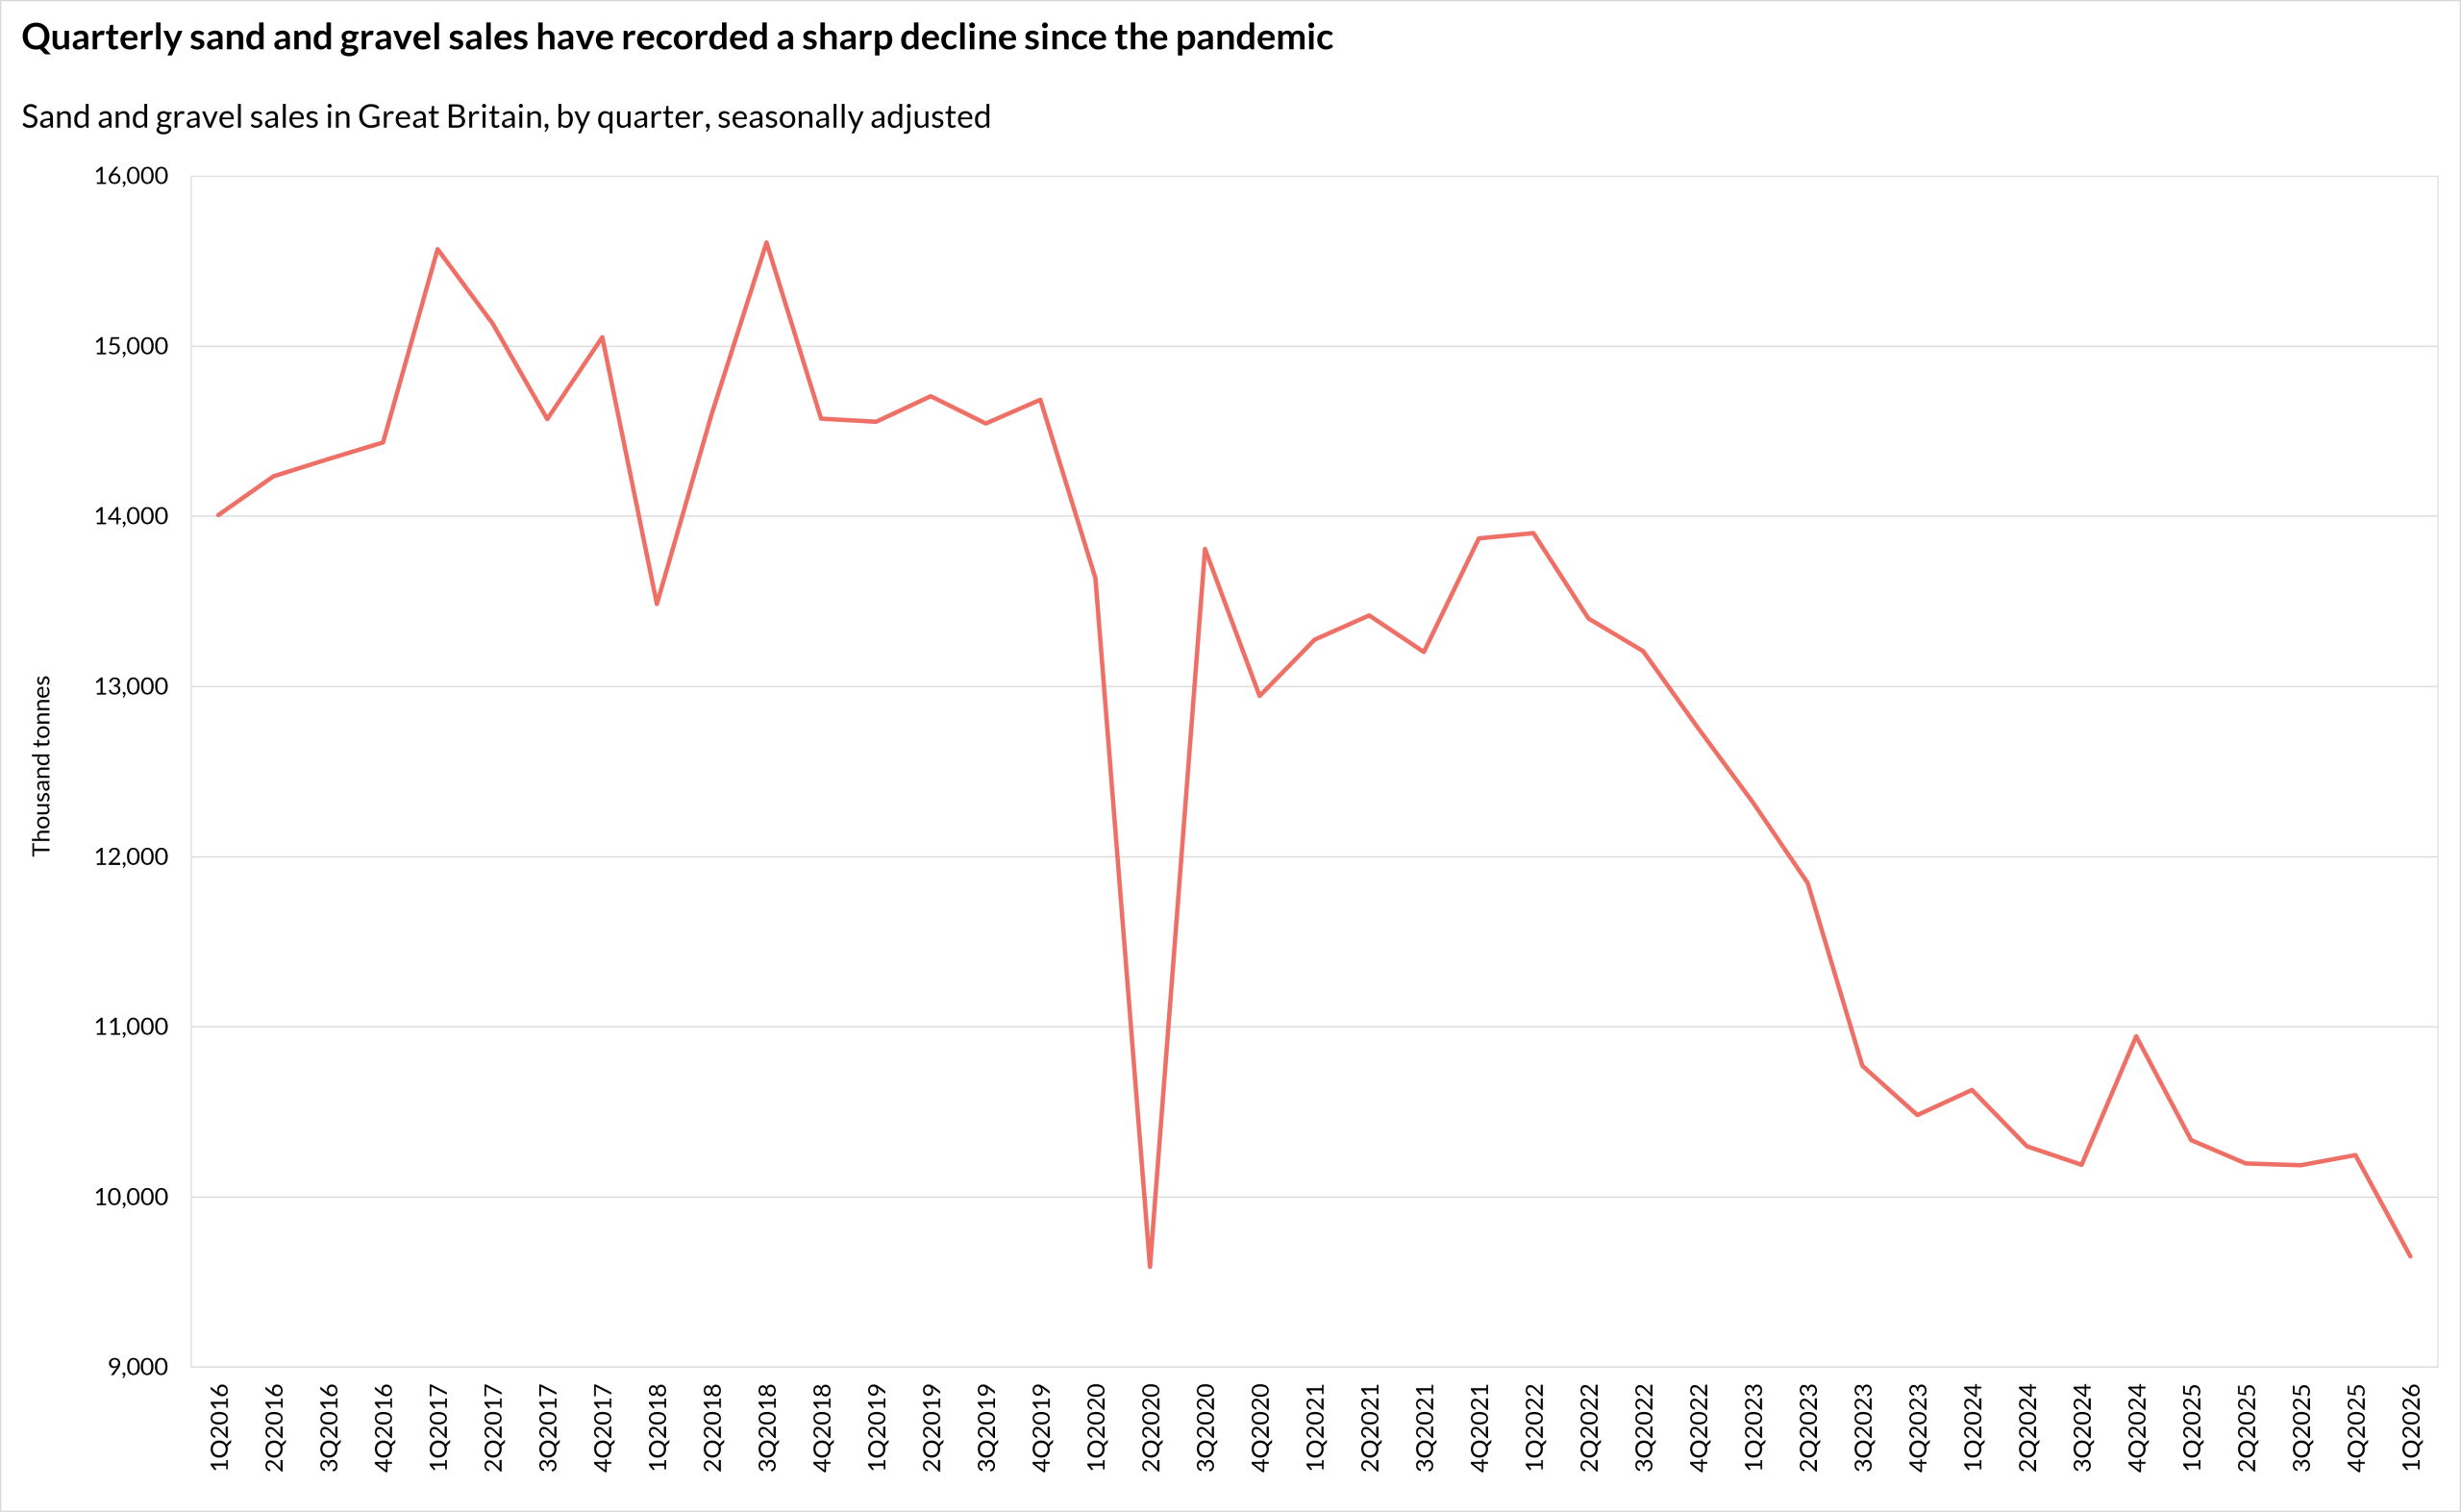
Source: Department for Business and Trade – Building materials and components statistics, Table 4a
Meanwhile, seasonally adjusted deliveries of ready-mixed concrete in 1Q2026 (2.5 million cubic metres) were down by 12.0% on 1Q2025 and by more than one-third on deliveries in the same quarter in 2019.
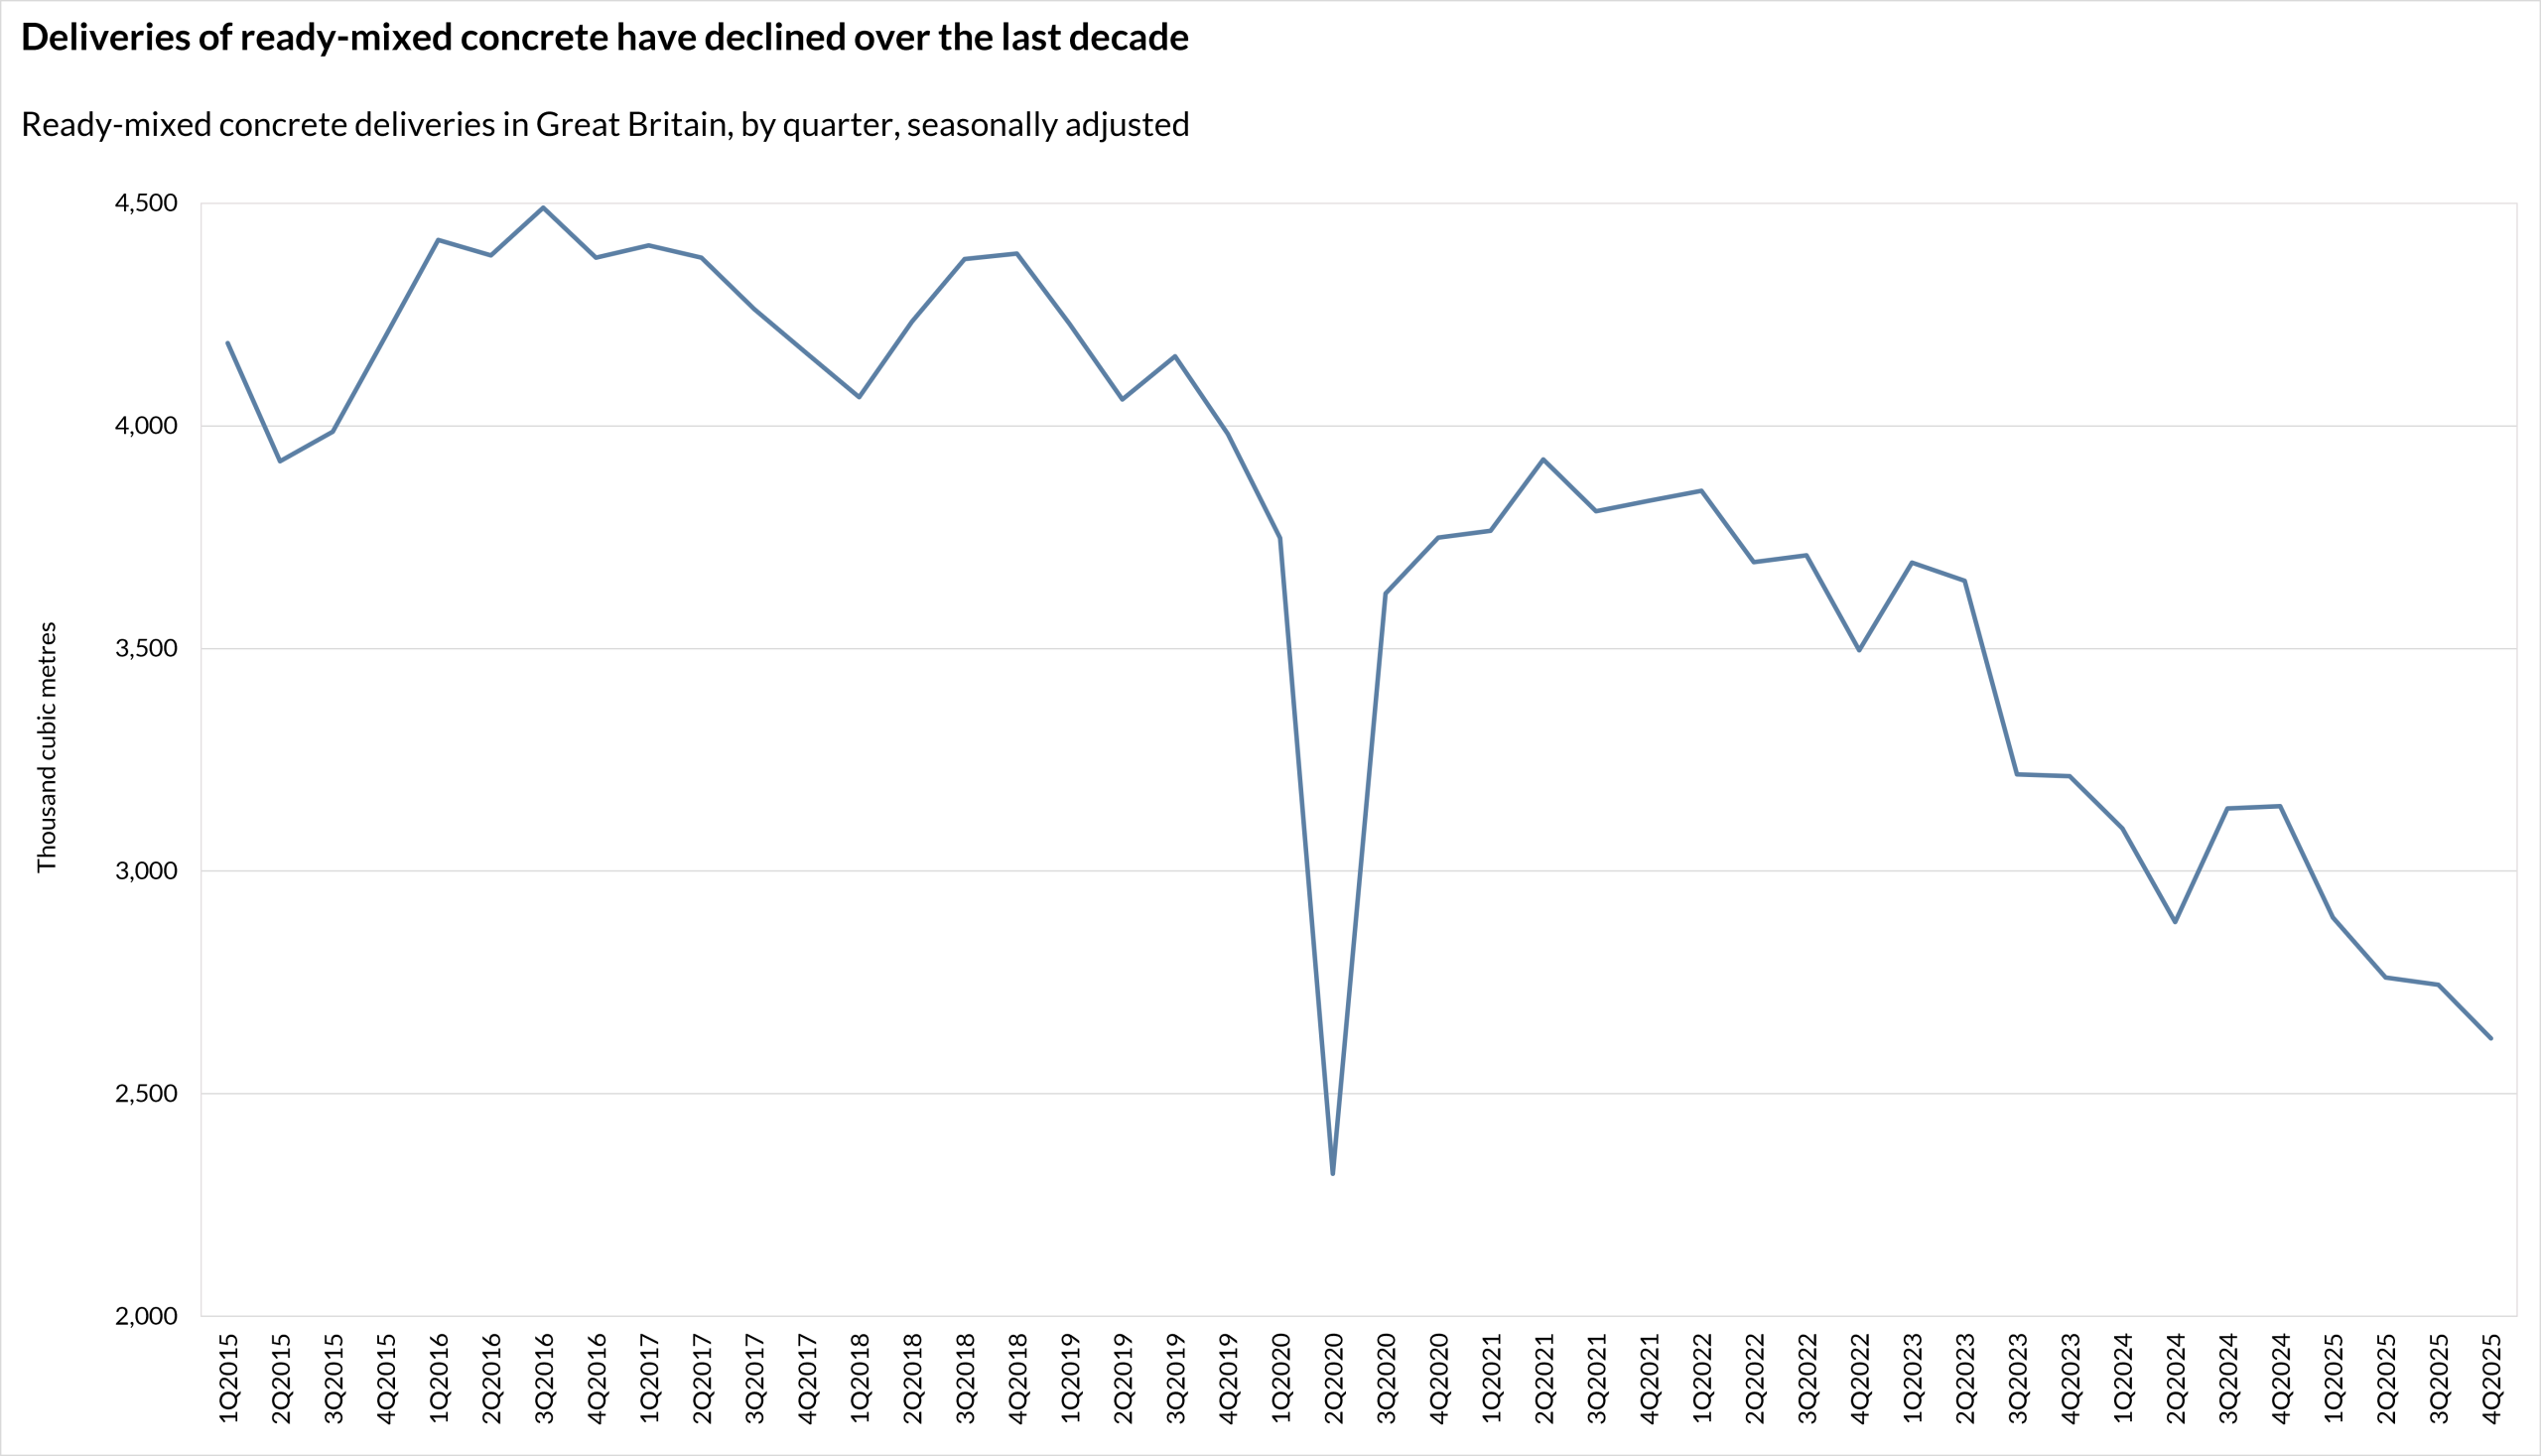
Source: Department for Business and Trade – Building materials and components statistics, Table 6a
Dr David Crosthwaite, chief economist at BCIS, said: ‘The sustained decline in brick and block deliveries, coupled with persistently high stock levels, points to a weak demand environment that shows little sign of improving. That is becoming an even greater concern as the government prepares for a change in leadership, with new priorities likely to emerge under front-runner Andy Burnham.
‘Promisingly, house building is expected to be high on the agenda and, if successfully accelerated, could help stimulate demand for key construction materials and provide a much-needed boost to supply chains.
‘However, the incoming administration is likely to face many of the same structural challenges as its predecessor, and there is little evidence at this stage that a change in leadership alone will deliver materially different outcomes. Reallocating capital spending towards defence is also unlikely to generate broad-based demand across the construction sector.
‘The priority should be to focus on policies that can deliver sustainable economic growth. A stronger economy will increase business confidence, encourage private investment and support demand for new housing, commercial development and infrastructure. If those foundations are in place, construction activity should follow naturally.’
To keep up to date with the latest industry news and insights from BCIS, register for our newsletter here.
(1) Building materials and components statistics: June 2026 - here